SOM cluster: 873
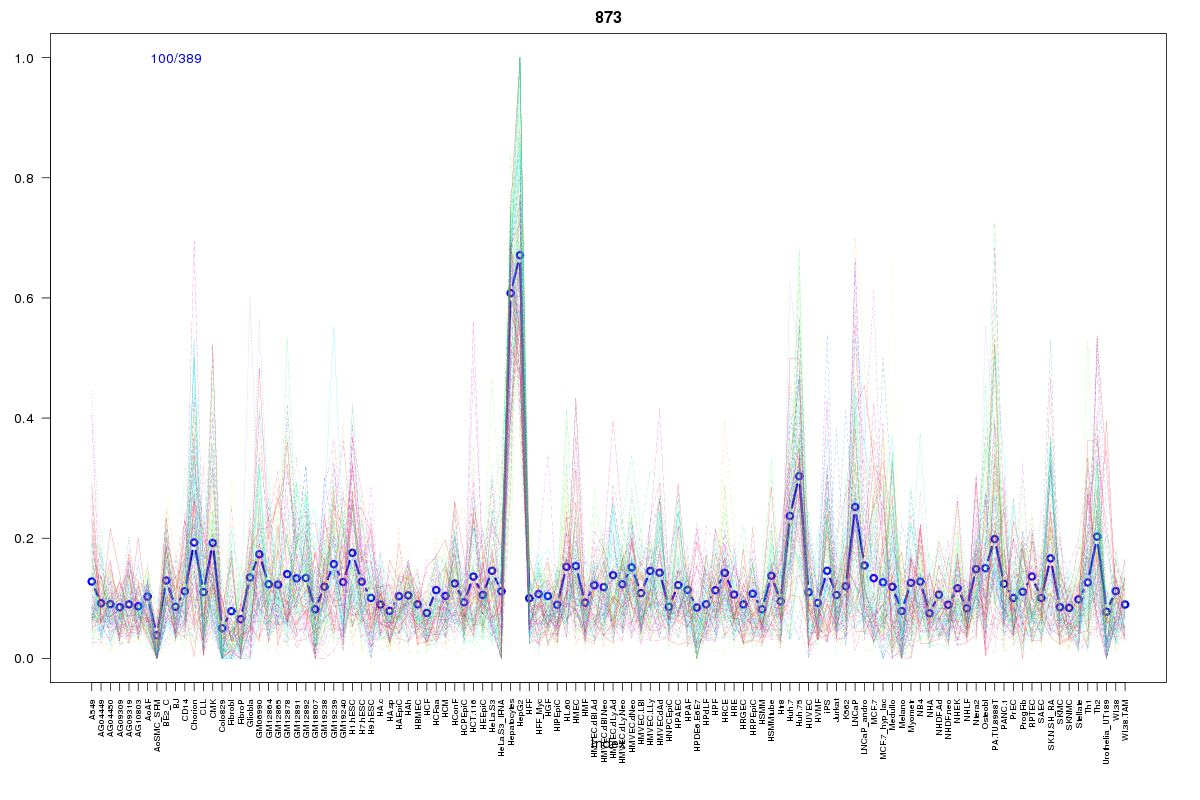
Cluster Hypersensitivity Profile

Genomic Location Trend
These plots show the distribution of the DHS sites surrounding the Transcript Start Site of the nearest gene.
Stats
Number of sites: 389Promoter: 33%
CpG-Island: 16%
Conserved: 38%
Enriched Motifs & Matches
Match Detail: [Jaspar]
|
| ||
|---|---|---|
| Sites: 92/100 | e-val: 0 | ||
| Factor | e-val(match) | DB |
| SP1 | 0.00000057397 | JASPAR |
| Pax4 | 0.0000042994 | JASPAR |
| RREB1 | 0.000082072 | JASPAR |
| PLAG1 | 0.00087131 | JASPAR |
| EWSR1-FLI1 | 0.0017442 | JASPAR |
|
| ||
| Sites: 99/100 | e-val: 6.4e-27 | ||
| Factor | e-val(match) | DB |
| SP1 | 0.000028678 | JASPAR |
| PLAG1 | 0.000039069 | JASPAR |
| ESR1 | 0.0023904 | JASPAR |
| INSM1 | 0.0029008 | JASPAR |
| Zfx | 0.0034819 | JASPAR |
|
| ||
| Sites: 29/100 | e-val: 0.013 | ||
| Factor | e-val(match) | DB |
| HNF4A | 0.000000013774 | JASPAR |
| PPARG::RXRA | 0.000000037218 | JASPAR |
| NR1H2::RXRA | 0.0000082104 | JASPAR |
| NR2F1 | 0.000042362 | JASPAR |
| INSM1 | 0.00043209 | JASPAR |
BED file downloads
Top 10 Example Regions
| Location | Gene Link | Dist. |
|---|---|---|
| chr12: 123326485-123326635 | CCDC62 | 26.46 |
| chr12: 123326485-123326635 | DENR | 26.46 |
| chr19: 18722005-18722155 | CRTC1 | 35.31 |
| chr16: 15083565-15083715 | PDXDC1 | 48.97 |
| chr20: 61848225-61848375 | YTHDF1 | 51.87 |
| chr19: 17354465-17354615 | USE1 | 52.97 |
| chr19: 17354465-17354615 | NR2F6 | 52.97 |
| chr16: 89761880-89762030 | SPATA2L | 53.03 |
| chr16: 89761880-89762030 | FANCA | 53.03 |
| chr16: 89761880-89762030 | CHMP1A | 53.03 |