SOM cluster: 868
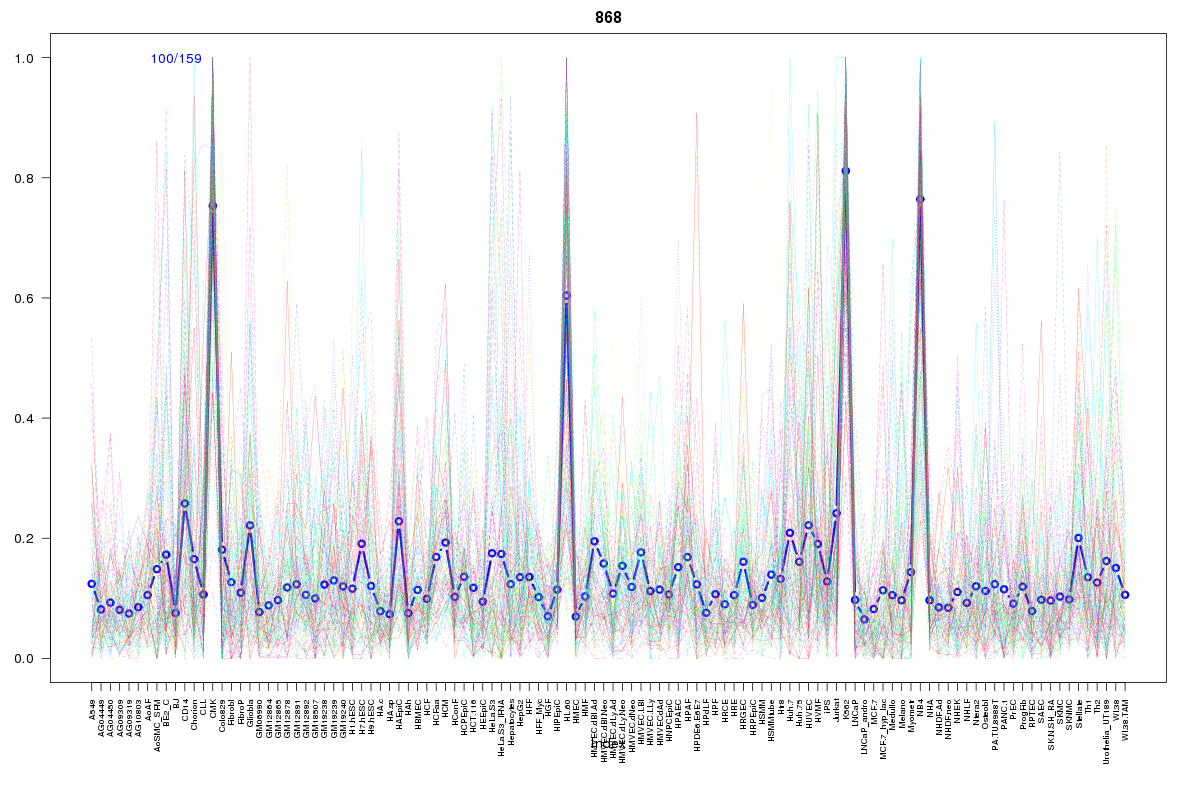
Cluster Hypersensitivity Profile

Genomic Location Trend
These plots show the distribution of the DHS sites surrounding the Transcript Start Site of the nearest gene.
Stats
Number of sites: 159Promoter: 11%
CpG-Island: 1%
Conserved: 41%
Enriched Motifs & Matches
Match Detail: [Jaspar]
|
| ||
|---|---|---|
| Sites: 36/100 | e-val: 1.8e-19 | ||
| Factor | e-val(match) | DB |
| EWSR1-FLI1 | 0.00000000000040623 | JASPAR |
| Pax4 | 0.0000023972 | JASPAR |
| SP1 | 0.000021967 | JASPAR |
| SPI1 | 0.00074192 | JASPAR |
| TEAD1 | 0.0025588 | JASPAR |
BED file downloads
Top 10 Example Regions
| Location | Gene Link | Dist. |
|---|---|---|
| chr8: 8102100-8102250 | SGK223 | 38.68 |
| chr8: 8102100-8102250 | ALG1L13P | 38.68 |
| chr1: 151342800-151342950 | POGZ | 45.39 |
| chr8: 38008180-38008330 | STAR | 47.24 |
| chr8: 38008180-38008330 | ASH2L | 47.24 |
| chr1: 38474820-38474970 | SF3A3 | 50.72 |
| chr6: 41998780-41998930 | TAF8 | 53.45 |
| chr6: 41998780-41998930 | C6orf132 | 53.45 |
| chr19: 48922080-48922230 | GRWD1 | 54.43 |
| chr19: 48922080-48922230 | KCNJ14 | 54.43 |