SOM cluster: 866
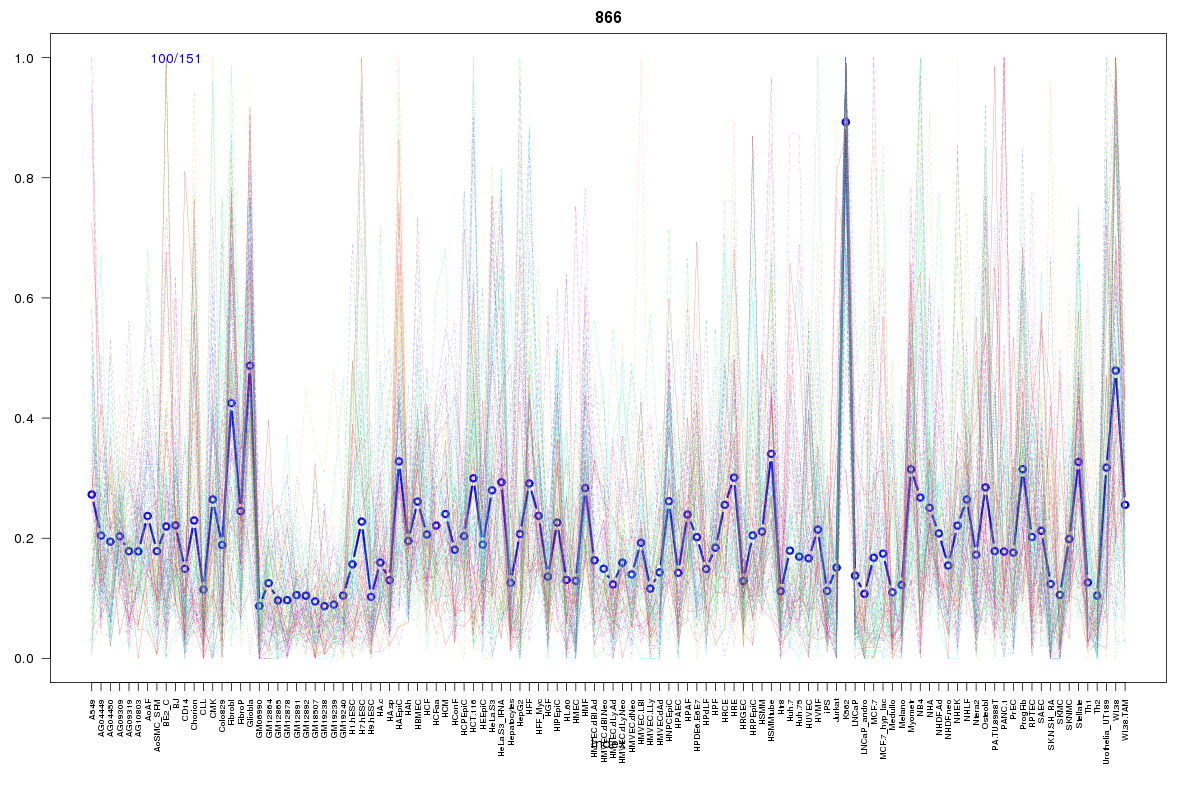
Cluster Hypersensitivity Profile

Genomic Location Trend
These plots show the distribution of the DHS sites surrounding the Transcript Start Site of the nearest gene.
Stats
Number of sites: 151Promoter: 10%
CpG-Island: 1%
Conserved: 28%
Enriched Motifs & Matches
Match Detail: [Jaspar]
|
| ||
|---|---|---|
| Sites: 51/100 | e-val: 1.6e-33 | ||
| Factor | e-val(match) | DB |
| NFE2L2 | 0.0000000000062562 | JASPAR |
| AP1 | 0.00000000046881 | JASPAR |
| NFE2L1::MafG | 0.00076993 | JASPAR |
| Pax2 | 0.002885 | JASPAR |
| PPARG | 0.0066379 | JASPAR |
|
| ||
| Sites: 29/100 | e-val: 3.6e-16 | ||
| Factor | e-val(match) | DB |
| SP1 | 0.000042697 | JASPAR |
| Pax4 | 0.00012374 | JASPAR |
| SPI1 | 0.0010269 | JASPAR |
| EWSR1-FLI1 | 0.0018043 | JASPAR |
| MZF1_5-13 | 0.013796 | JASPAR |
BED file downloads
Top 10 Example Regions
| Location | Gene Link | Dist. |
|---|---|---|
| chr19: 38761385-38761535 | YIF1B | 35.46 |
| chr8: 38011640-38011790 | EIF4EBP1 | 51.85 |
| chr8: 38011640-38011790 | STAR | 51.85 |
| chr8: 38011640-38011790 | LSM1 | 51.85 |
| chr9: 132239140-132239290 | LINC00963 | 52.48 |
| chr9: 132239140-132239290 | RP11-492E3.2 | 52.48 |
| chr5: 148835800-148835950 | RP11-394O4.3 | 54.5 |
| chr17: 42281800-42281950 | SLC4A1 | 61.71 |
| chr19: 49201460-49201610 | SPHK2 | 65.34 |
| chr2: 28583765-28583915 | FOSL2 | 67.96 |