SOM cluster: 852
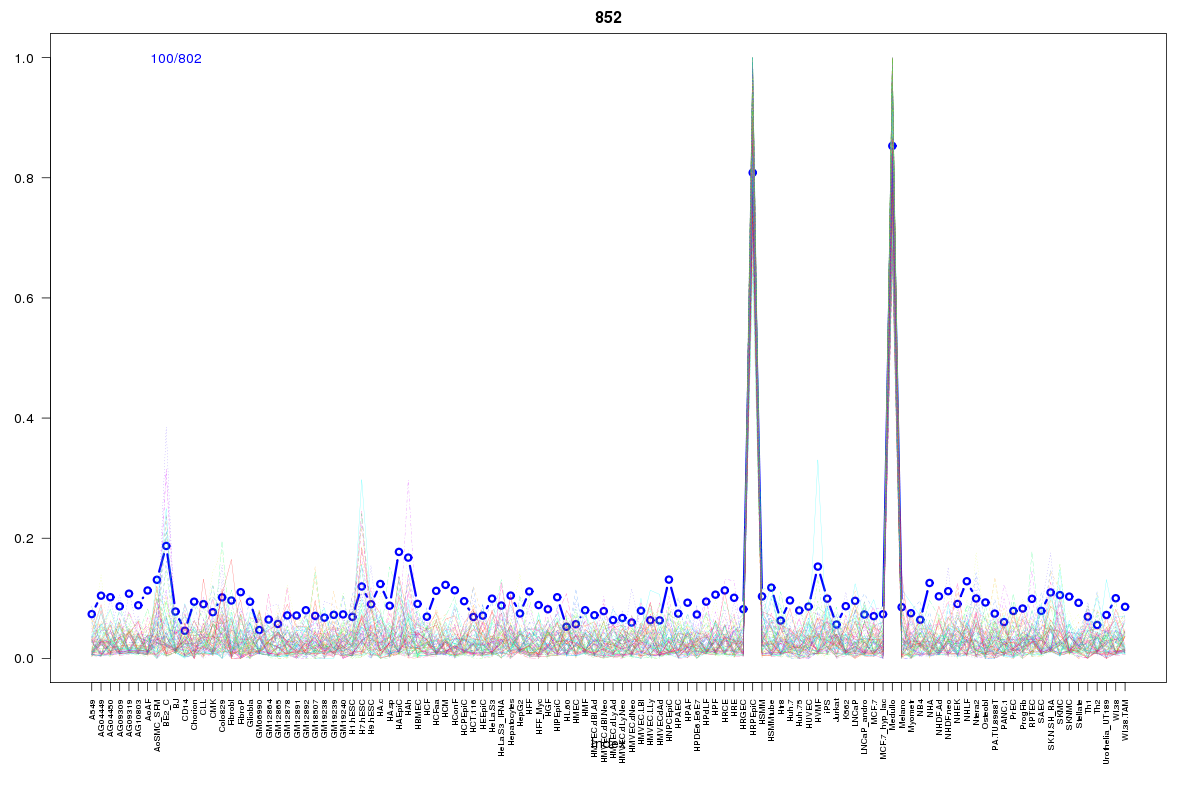
Cluster Hypersensitivity Profile

Genomic Location Trend
These plots show the distribution of the DHS sites surrounding the Transcript Start Site of the nearest gene.
Stats
Number of sites: 802Promoter: 2%
CpG-Island: 1%
Conserved: 46%
Enriched Motifs & Matches
Match Detail: [Jaspar]
|
| ||
|---|---|---|
| Sites: 55/100 | e-val: 1.6e-34 | ||
| Factor | e-val(match) | DB |
| SPIB | 0.0010268 | JASPAR |
| Prrx2 | 0.012968 | JASPAR |
| GATA2 | 0.02022 | JASPAR |
| Pdx1 | 0.042582 | JASPAR |
| NFKB1 | 0.057366 | JASPAR |
BED file downloads
Top 10 Example Regions
| Location | Gene Link | Dist. |
|---|---|---|
| chr1: 53608280-53608430 | SLC1A7 | 37.92 |
| chr1: 159908080-159908230 | IGSF9 | 46.2 |
| chr17: 1456820-1456970 | PITPNA | 49.31 |
| chr3: 154316060-154316210 | CTD-2501O3.2 | 50.8 |
| chr3: 47577880-47578030 | CSPG5 | 54.79 |
| chr8: 10389880-10390030 | RP1L1 | 57.71 |
| chr5: 159689280-159689430 | FABP6 | 63.26 |
| chr7: 105784300-105784450 | SYPL1 | 68.26 |
| chr12: 53350940-53351090 | RPL7P41 | 71.97 |
| chr12: 53350940-53351090 | KRT18 | 71.97 |