SOM cluster: 848
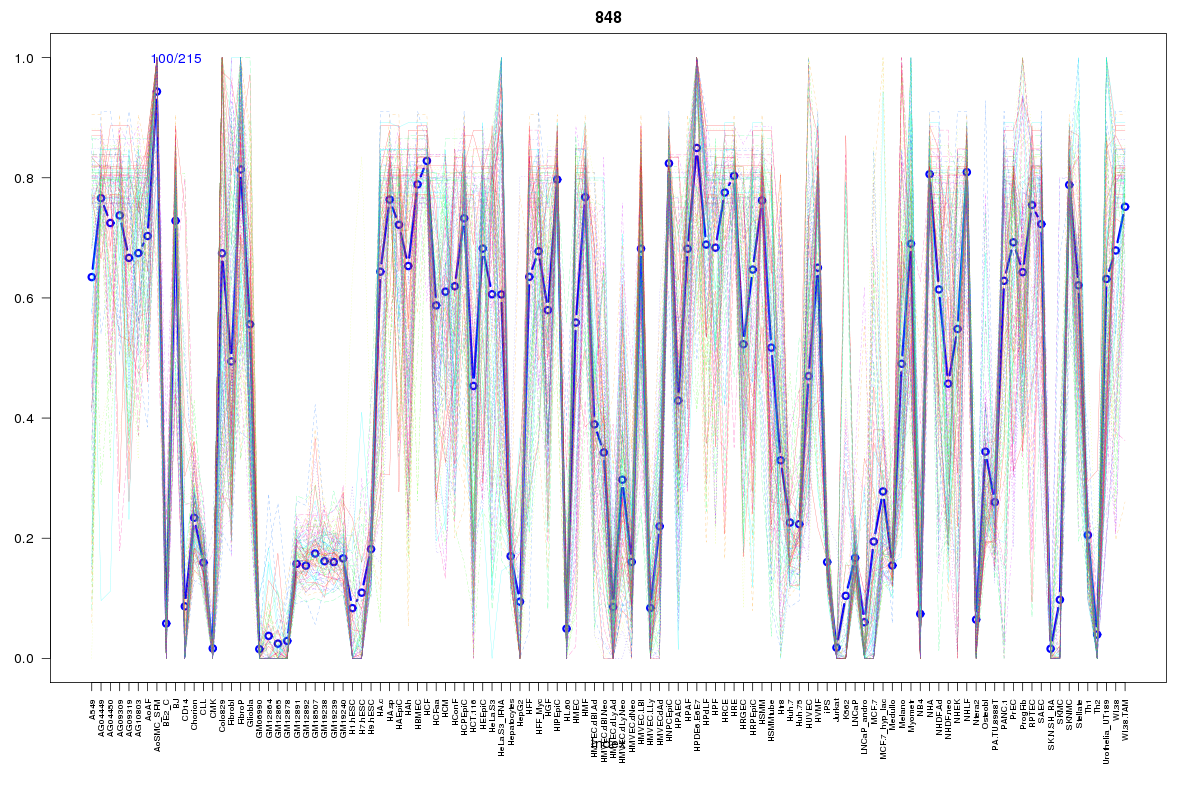
Cluster Hypersensitivity Profile

Genomic Location Trend
These plots show the distribution of the DHS sites surrounding the Transcript Start Site of the nearest gene.
Stats
Number of sites: 215Promoter: 0%
CpG-Island: 0%
Conserved: 43%
Enriched Motifs & Matches
Match Detail: [Jaspar]
|
| ||
|---|---|---|
| Sites: 58/100 | e-val: 8e-30 | ||
| Factor | e-val(match) | DB |
| AP1 | 0.000000000045495 | JASPAR |
| NFE2L2 | 0.0000000065926 | JASPAR |
| PPARG | 0.0036337 | JASPAR |
| NFE2L1::MafG | 0.0043697 | JASPAR |
| Pax6 | 0.015831 | JASPAR |
BED file downloads
Top 10 Example Regions
| Location | Gene Link | Dist. |
|---|---|---|
| chr1: 202261580-202261730 | UBE2T | 38.28 |
| chr1: 202261580-202261730 | CYCSP4 | 38.28 |
| chr3: 149105920-149106070 | TM4SF1 | 39.34 |
| chr3: 149105920-149106070 | RP11-278L15.3 | 39.34 |
| chr1: 66987540-66987690 | SGIP1 | 52.45 |
| chr11: 110067000-110067150 | ZC3H12C | 55.67 |
| chr11: 110067000-110067150 | RDX | 55.67 |
| chr9: 33329420-33329570 | BAG1 | 56.24 |
| chr9: 35688840-35688990 | TESK1 | 56.56 |
| chr9: 35688840-35688990 | TPM2 | 56.56 |