SOM cluster: 847
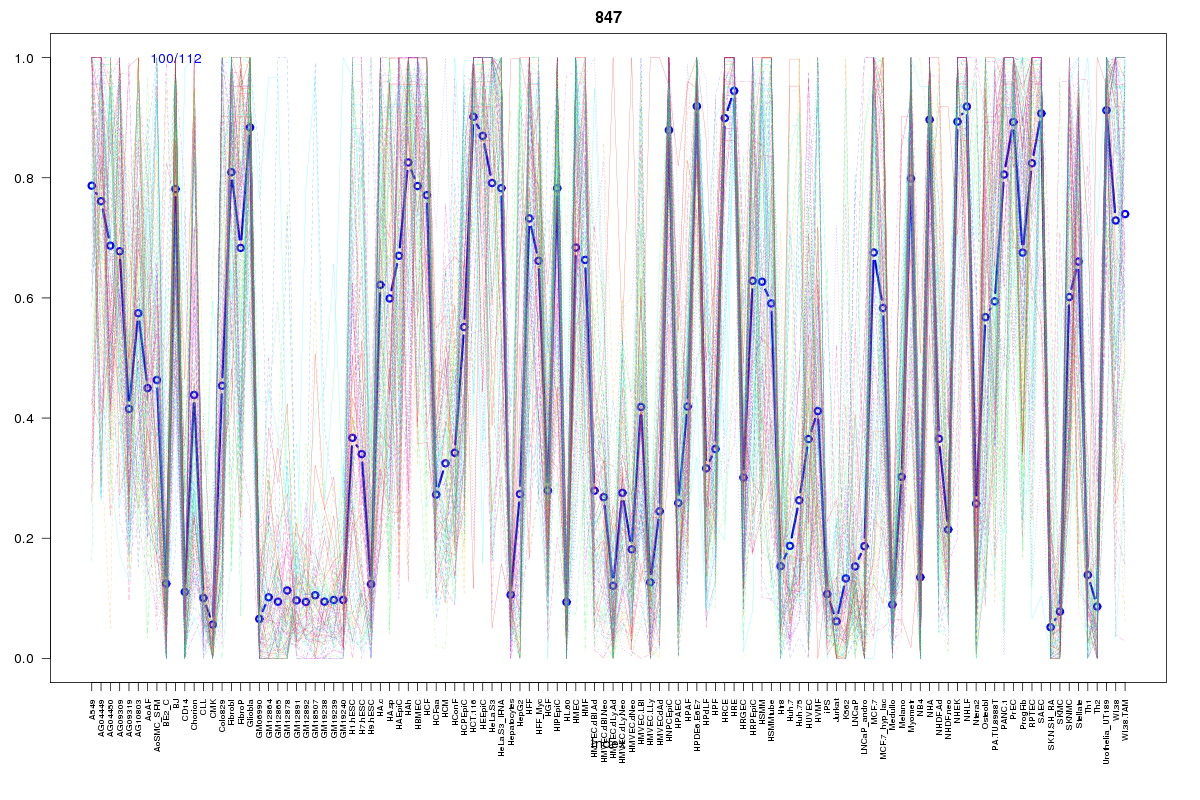
Cluster Hypersensitivity Profile

Genomic Location Trend
These plots show the distribution of the DHS sites surrounding the Transcript Start Site of the nearest gene.
Stats
Number of sites: 112Promoter: 3%
CpG-Island: 0%
Conserved: 44%
Enriched Motifs & Matches
Match Detail: [Jaspar]
|
| ||
|---|---|---|
| Sites: 59/100 | e-val: 4.80001e-41 | ||
| Factor | e-val(match) | DB |
| AP1 | 0.0000000035463 | JASPAR |
| NFE2L2 | 0.000020944 | JASPAR |
| NFE2L1::MafG | 0.023253 | JASPAR |
| Pax2 | 0.1169 | JASPAR |
| CREB1 | 0.11889 | JASPAR |
BED file downloads
Top 10 Example Regions
| Location | Gene Link | Dist. |
|---|---|---|
| chr8: 124540540-124540690 | FBXO32 | 56.16 |
| chr12: 1628480-1628630 | WNT5B | 56.71 |
| chr3: 197243520-197243670 | BDH1 | 58.24 |
| chr3: 197243520-197243670 | AC024560.3 | 58.24 |
| chr20: 45443585-45443735 | RN7SKP33 | 59.32 |
| chr6: 12348960-12349110 | RN7SKP293 | 59.51 |
| chr16: 16060900-16061050 | ABCC1 | 61.04 |
| chr6: 7505640-7505790 | DSP | 63.26 |
| chr15: 71385760-71385910 | THSD4 | 63.45 |
| chr6: 17589760-17589910 | FAM8A1 | 64.3 |