SOM cluster: 833
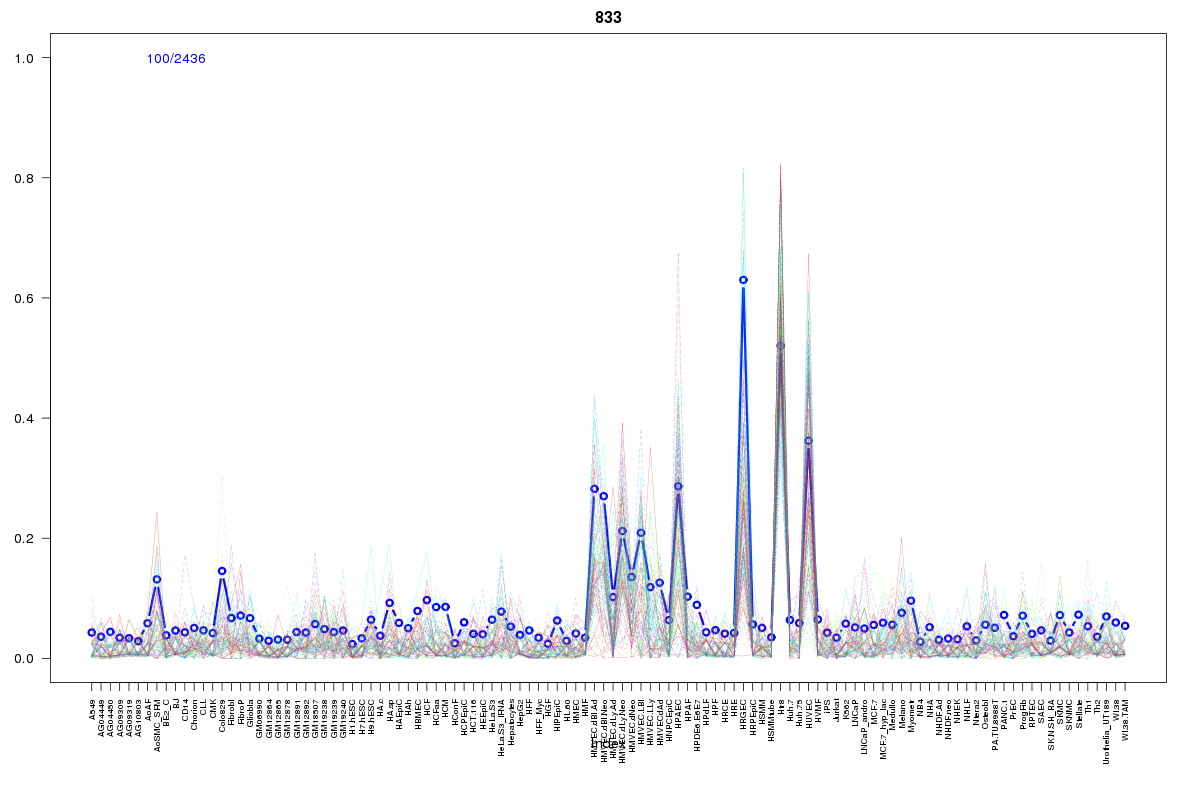
Cluster Hypersensitivity Profile

Genomic Location Trend
These plots show the distribution of the DHS sites surrounding the Transcript Start Site of the nearest gene.
Stats
Number of sites: 2436Promoter: 0%
CpG-Island: 0%
Conserved: 32%
Enriched Motifs & Matches
Match Detail: [Jaspar]
|
| ||
|---|---|---|
| Sites: 56/100 | e-val: 1.2e-30 | ||
| Factor | e-val(match) | DB |
| Foxd3 | 0.000059503 | JASPAR |
| Lhx3 | 0.0012563 | JASPAR |
| Foxq1 | 0.002794 | JASPAR |
| ARID3A | 0.012004 | JASPAR |
| NFATC2 | 0.021452 | JASPAR |
BED file downloads
Top 10 Example Regions
| Location | Gene Link | Dist. |
|---|---|---|
| chr8: 38617120-38617270 | TACC1 | 34.85 |
| chr9: 116716105-116716255 | ZNF618 | 37.03 |
| chr1: 22223665-22223815 | HSPG2 | 39.89 |
| chr9: 107591940-107592090 | NIPSNAP3B | 40.64 |
| chr17: 68154840-68154990 | KCNJ2 | 41.65 |
| chr8: 75178980-75179130 | RP1-16A9.1 | 47.59 |
| chr3: 173462420-173462570 | NLGN1 | 51.33 |
| chr1: 56614540-56614690 | RP4-710M16.1 | 53.47 |
| chr11: 33747140-33747390 | CD59 | 54.51 |
| chr4: 146466240-146466390 | SMAD1-AS1 | 55.26 |