SOM cluster: 83
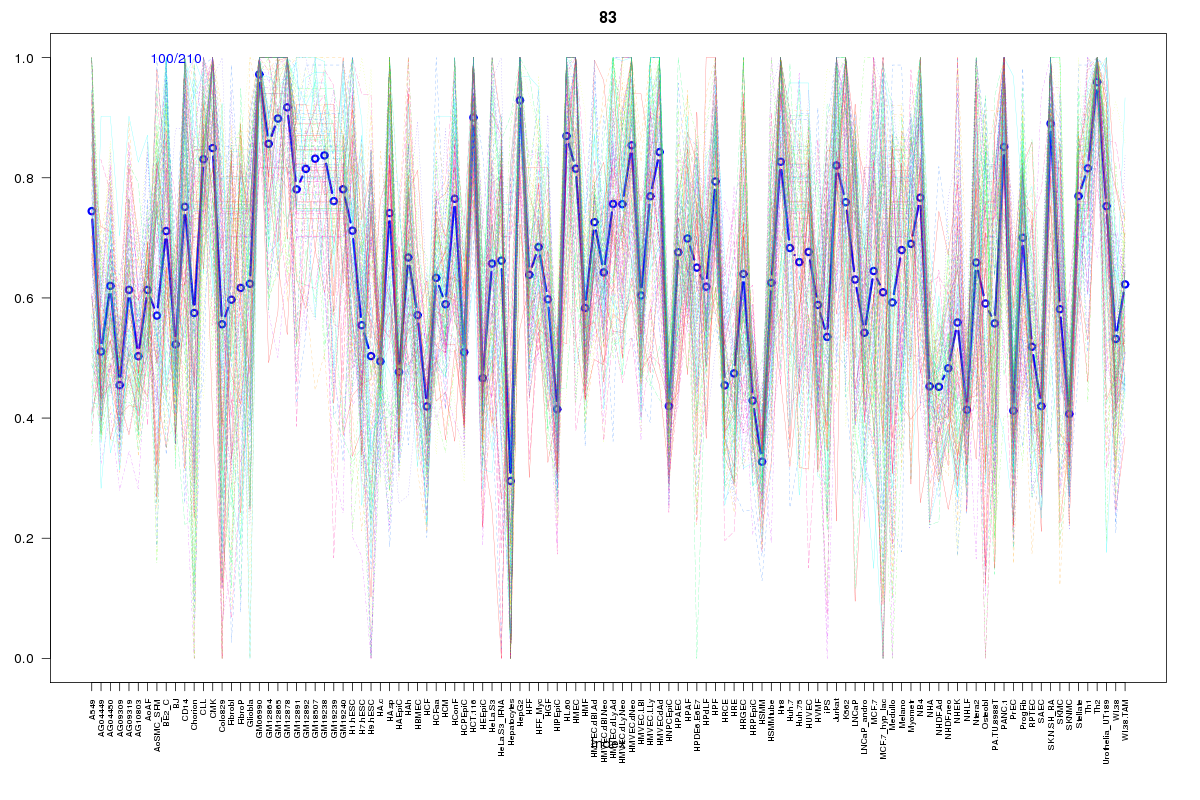
Cluster Hypersensitivity Profile

Genomic Location Trend
These plots show the distribution of the DHS sites surrounding the Transcript Start Site of the nearest gene.
Stats
Number of sites: 210Promoter: 67%
CpG-Island: 88%
Conserved: 79%
Enriched Motifs & Matches
Match Detail: [Jaspar]
|
| ||
|---|---|---|
| Sites: 100/100 | e-val: 1.4013e-45 | ||
| Factor | e-val(match) | DB |
| SP1 | 0.00000011144 | JASPAR |
| TFAP2A | 0.0000089857 | JASPAR |
| PLAG1 | 0.000095232 | JASPAR |
| Egr1 | 0.0066419 | JASPAR |
| Klf4 | 0.0093777 | JASPAR |
BED file downloads
Top 10 Example Regions
| Location | Gene Link | Dist. |
|---|---|---|
| chr17: 74723220-74723370 | MXRA7 | 29.6 |
| chr2: 30669980-30670130 | AC109642.1 | 45.58 |
| chr8: 141521040-141521190 | TRAPPC9 | 48.88 |
| chr1: 224517800-224517950 | NVL | 49.52 |
| chr5: 68628560-68628710 | CFL1P5 | 51.6 |
| chr5: 68628560-68628710 | TAF9 | 51.6 |
| chr5: 68628560-68628710 | RAD17 | 51.6 |
| chr5: 68628560-68628710 | CCDC125 | 51.6 |
| chrX: 15693160-15693310 | CA5B | 51.65 |
| chrX: 15693160-15693310 | CA5BP1 | 51.65 |