SOM cluster: 822
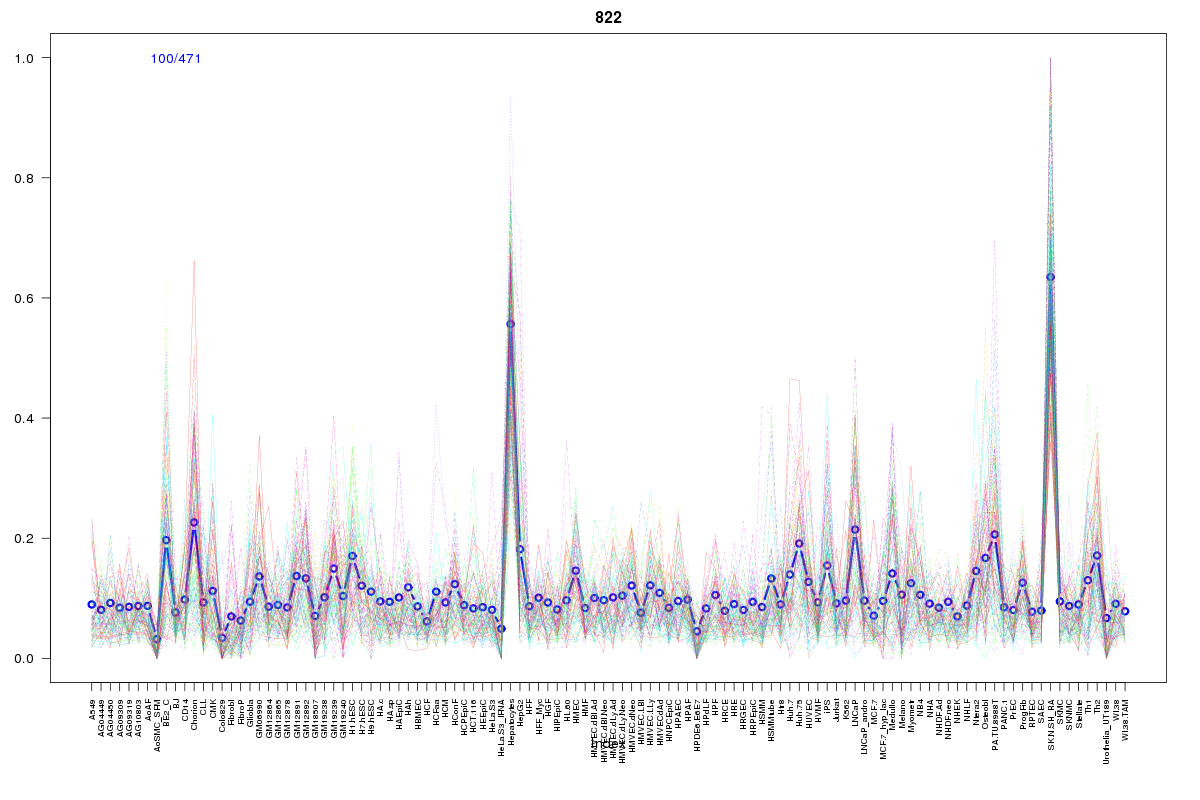
Cluster Hypersensitivity Profile

Genomic Location Trend
These plots show the distribution of the DHS sites surrounding the Transcript Start Site of the nearest gene.
Stats
Number of sites: 471Promoter: 20%
CpG-Island: 37%
Conserved: 47%
Enriched Motifs & Matches
Match Detail: [Jaspar]
|
| ||
|---|---|---|
| Sites: 91/100 | e-val: 0 | ||
| Factor | e-val(match) | DB |
| SP1 | 0.00000010576 | JASPAR |
| RREB1 | 0.000041863 | JASPAR |
| Klf4 | 0.00042581 | JASPAR |
| Tal1::Gata1 | 0.00073487 | JASPAR |
| PLAG1 | 0.00091051 | JASPAR |
|
| ||
| Sites: 56/100 | e-val: 0.00041 | ||
| Factor | e-val(match) | DB |
| EBF1 | 0.010856 | JASPAR |
| TP53 | 0.017472 | JASPAR |
| TFAP2A | 0.032042 | JASPAR |
| NHLH1 | 0.040894 | JASPAR |
| Egr1 | 0.082102 | JASPAR |
BED file downloads
Top 10 Example Regions
| Location | Gene Link | Dist. |
|---|---|---|
| chr1: 156645825-156645975 | NES | 50.24 |
| chr18: 24765405-24765555 | CHST9 | 52.24 |
| chr19: 2229845-2229995 | OAZ1 | 54.19 |
| chr4: 6200425-6200575 | JAKMIP1 | 55.28 |
| chr12: 96336000-96336150 | AMDHD1 | 55.8 |
| chr12: 96336000-96336150 | RP11-256L6.3 | 55.8 |
| chr9: 124989345-124989495 | NDUFA8 | 56.61 |
| chr3: 37494345-37494495 | ITGA9 | 56.9 |
| chr7: 100822725-100822875 | TRIM56 | 57.77 |
| chr2: 241829265-241829415 | C2orf54 | 58.43 |