SOM cluster: 82
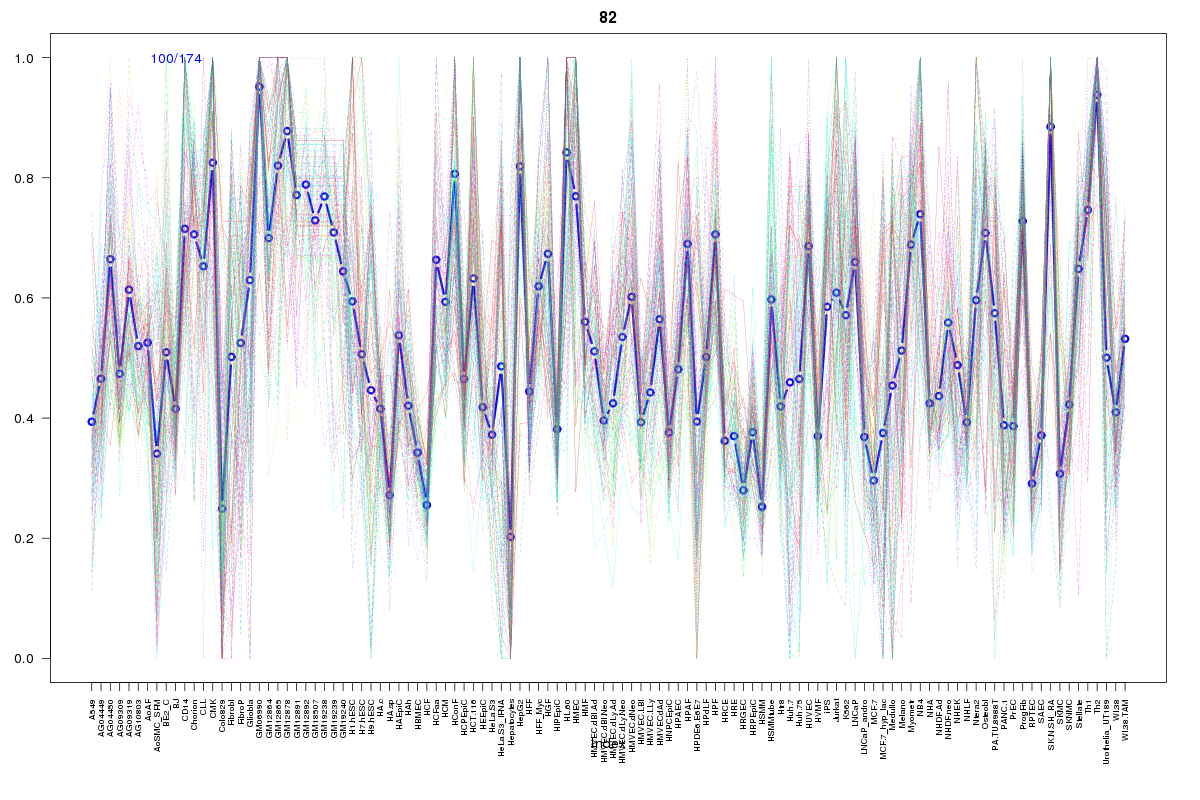
Cluster Hypersensitivity Profile

Genomic Location Trend
These plots show the distribution of the DHS sites surrounding the Transcript Start Site of the nearest gene.
Stats
Number of sites: 174Promoter: 55%
CpG-Island: 93%
Conserved: 74%
Enriched Motifs & Matches
Match Detail: [Jaspar]
|
| ||
|---|---|---|
| Sites: 95/100 | e-val: 0 | ||
| Factor | e-val(match) | DB |
| SP1 | 0.0000033834 | JASPAR |
| TFAP2A | 0.000032565 | JASPAR |
| PLAG1 | 0.0051141 | JASPAR |
| Klf4 | 0.027986 | JASPAR |
| INSM1 | 0.05873 | JASPAR |
|
| ||
| Sites: 83/100 | e-val: 1.2e-27 | ||
| Factor | e-val(match) | DB |
| SP1 | 0.000000035689 | JASPAR |
| PLAG1 | 0.00034727 | JASPAR |
| Klf4 | 0.0023736 | JASPAR |
| TFAP2A | 0.0042239 | JASPAR |
| Zfx | 0.024272 | JASPAR |
BED file downloads
Top 10 Example Regions
| Location | Gene Link | Dist. |
|---|---|---|
| chr12: 27933300-27933450 | RP11-860B13.1 | 30.19 |
| chr12: 1770880-1771030 | RPS4XP14 | 46.13 |
| chr13: 115047580-115047730 | CLCP2 | 46.93 |
| chr1: 161696740-161696890 | DUSP12 | 47.26 |
| chr1: 161696740-161696890 | ATF6 | 47.26 |
| chr1: 182758740-182758890 | RP11-317P15.3 | 53.39 |
| chr17: 2497380-2497530 | snoU13 | 53.92 |
| chr1: 210502540-210502690 | HHAT | 56.96 |
| chr4: 187112380-187112530 | KLKB1 | 58.42 |
| chr1: 226297780-226297930 | ACBD3 | 62.33 |