SOM cluster: 807
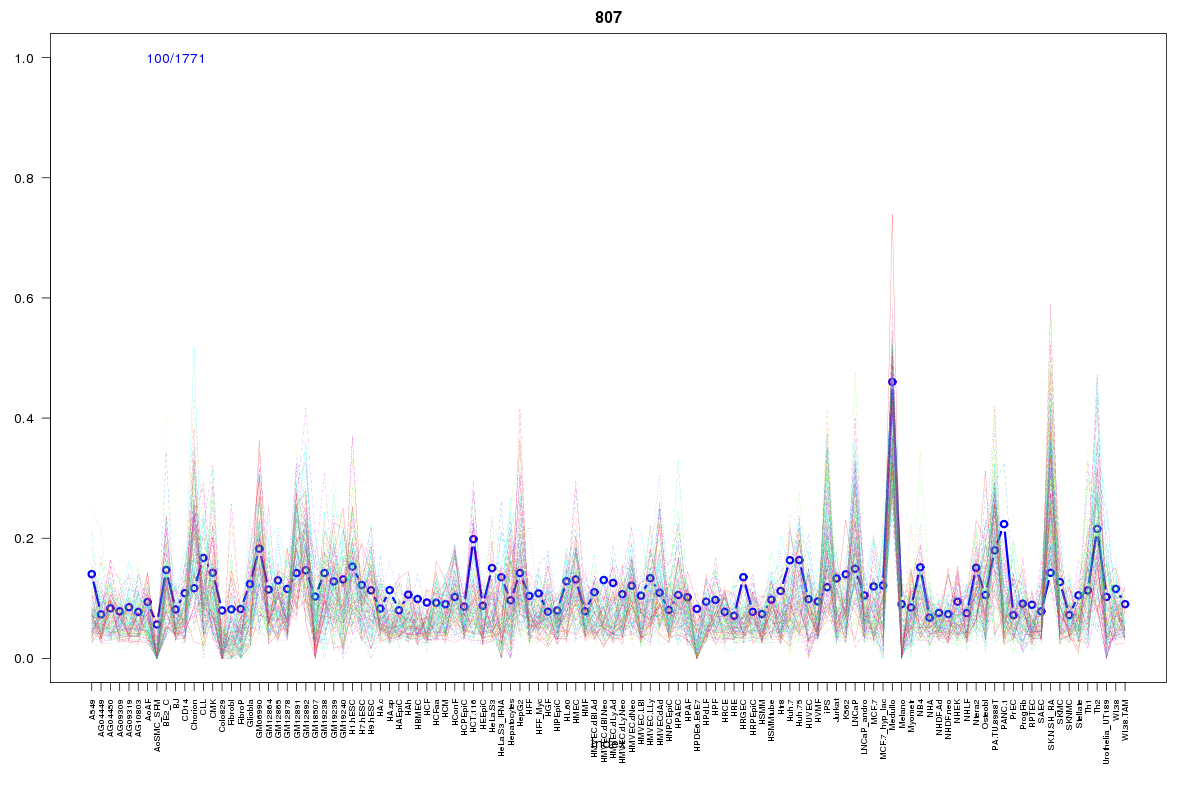
Cluster Hypersensitivity Profile

Genomic Location Trend
These plots show the distribution of the DHS sites surrounding the Transcript Start Site of the nearest gene.
Stats
Number of sites: 1771Promoter: 10%
CpG-Island: 22%
Conserved: 29%
Enriched Motifs & Matches
Match Detail: [Jaspar]
|
| ||
|---|---|---|
| Sites: 88/100 | e-val: 0 | ||
| Factor | e-val(match) | DB |
| SP1 | 0.00000012203 | JASPAR |
| PLAG1 | 0.00017409 | JASPAR |
| Egr1 | 0.00023854 | JASPAR |
| Pax4 | 0.00048683 | JASPAR |
| RREB1 | 0.00073239 | JASPAR |
|
| ||
| Sites: 92/100 | e-val: 1.8e-18 | ||
| Factor | e-val(match) | DB |
| PLAG1 | 0.000045855 | JASPAR |
| Zfp423 | 0.00032579 | JASPAR |
| TFAP2A | 0.0014762 | JASPAR |
| EBF1 | 0.0018923 | JASPAR |
| ESR1 | 0.011048 | JASPAR |
|
| ||
| Sites: 29/100 | e-val: 0.011 | ||
| Factor | e-val(match) | DB |
| Myf | 0.0000018854 | JASPAR |
| REST | 0.0034888 | JASPAR |
| RREB1 | 0.0066292 | JASPAR |
| Klf4 | 0.0098699 | JASPAR |
| NHLH1 | 0.011103 | JASPAR |
BED file downloads
Top 10 Example Regions
| Location | Gene Link | Dist. |
|---|---|---|
| chr1: 145515605-145515755 | HFE2 | 13.02 |
| chr1: 145515605-145515755 | GNRHR2 | 13.02 |
| chr1: 145515605-145515755 | PIAS3 | 13.02 |
| chr1: 145515605-145515755 | ITGA10 | 13.02 |
| chr1: 149889105-149889255 | SV2A | 15.88 |
| chr1: 150522720-150522870 | MCL1 | 17.67 |
| chr1: 151256065-151256215 | ZNF687 | 36.07 |
| chr1: 151256065-151256215 | RP11-126K1.2 | 36.07 |
| chr9: 139067160-139067310 | LHX3 | 40.06 |
| chr8: 143540785-143540935 | BAI1 | 46.38 |