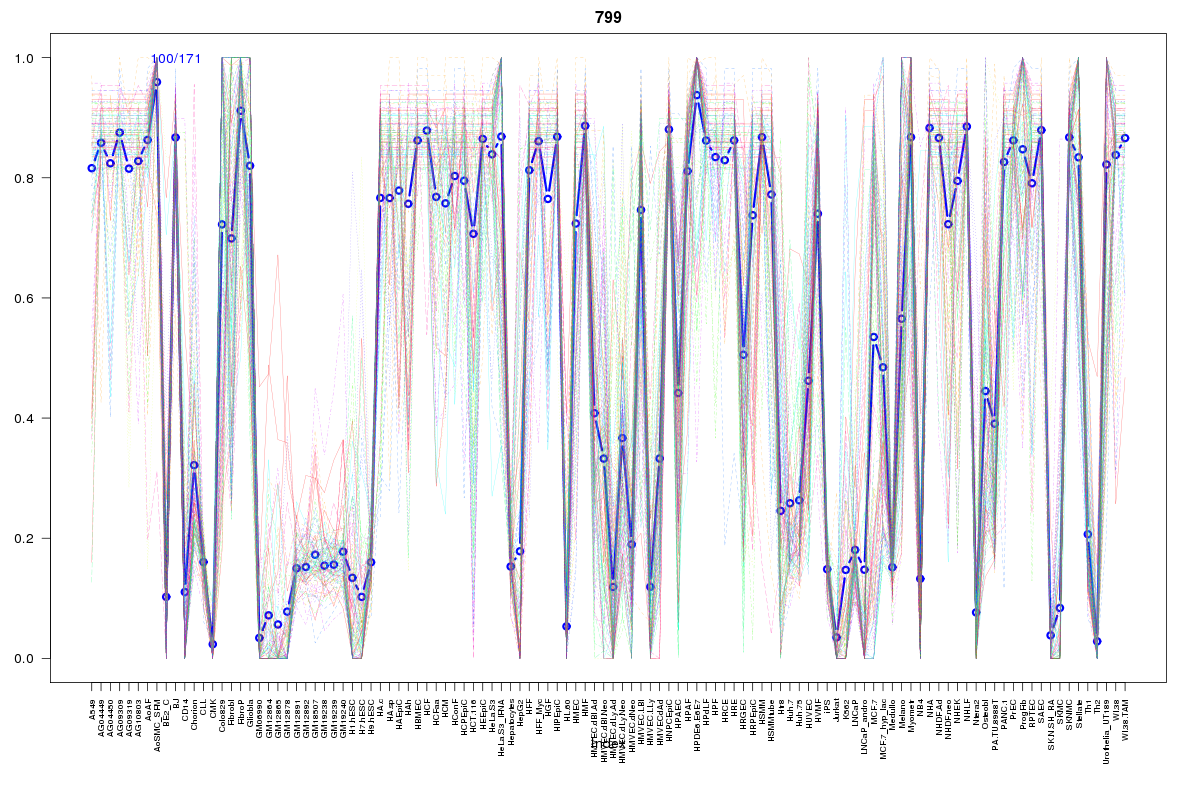
SOM cluster: 799
Cluster Hypersensitivity Profile

Genomic Location Trend
These plots show the distribution of the DHS sites surrounding the Transcript Start Site of the nearest gene.
Stats
Number of sites: 171Promoter: 1%
CpG-Island: 0%
Conserved: 54%
Enriched Motifs & Matches
Match Detail: [Jaspar]
|
| ||
|---|---|---|
| Sites: 57/100 | e-val: 3.7e-23 | ||
| Factor | e-val(match) | DB |
| AP1 | 0.0000000019141 | JASPAR |
| NFE2L2 | 0.00000072689 | JASPAR |
| PBX1 | 0.0063658 | JASPAR |
| NFE2L1::MafG | 0.012956 | JASPAR |
| Pdx1 | 0.026058 | JASPAR |
BED file downloads
Top 10 Example Regions
| Location | Gene Link | Dist. |
|---|---|---|
| chr12: 93153780-93153930 | EEA1 | 32.48 |
| chr12: 93153780-93153930 | PLEKHG7 | 32.48 |
| chr12: 93153780-93153930 | C12orf74 | 32.48 |
| chr5: 95158540-95158690 | ELL2 | 47.14 |
| chr5: 95158540-95158690 | HSPD1P11 | 47.14 |
| chr5: 95158540-95158690 | RHOBTB3 | 47.14 |
| chr8: 122736880-122737030 | HAS2 | 49.58 |
| chr8: 122736880-122737030 | HAS2-AS1 | 49.58 |
| chr10: 25191100-25191250 | ENKUR | 54.86 |
| chr10: 25191100-25191250 | PRTFDC1 | 54.86 |