SOM cluster: 798
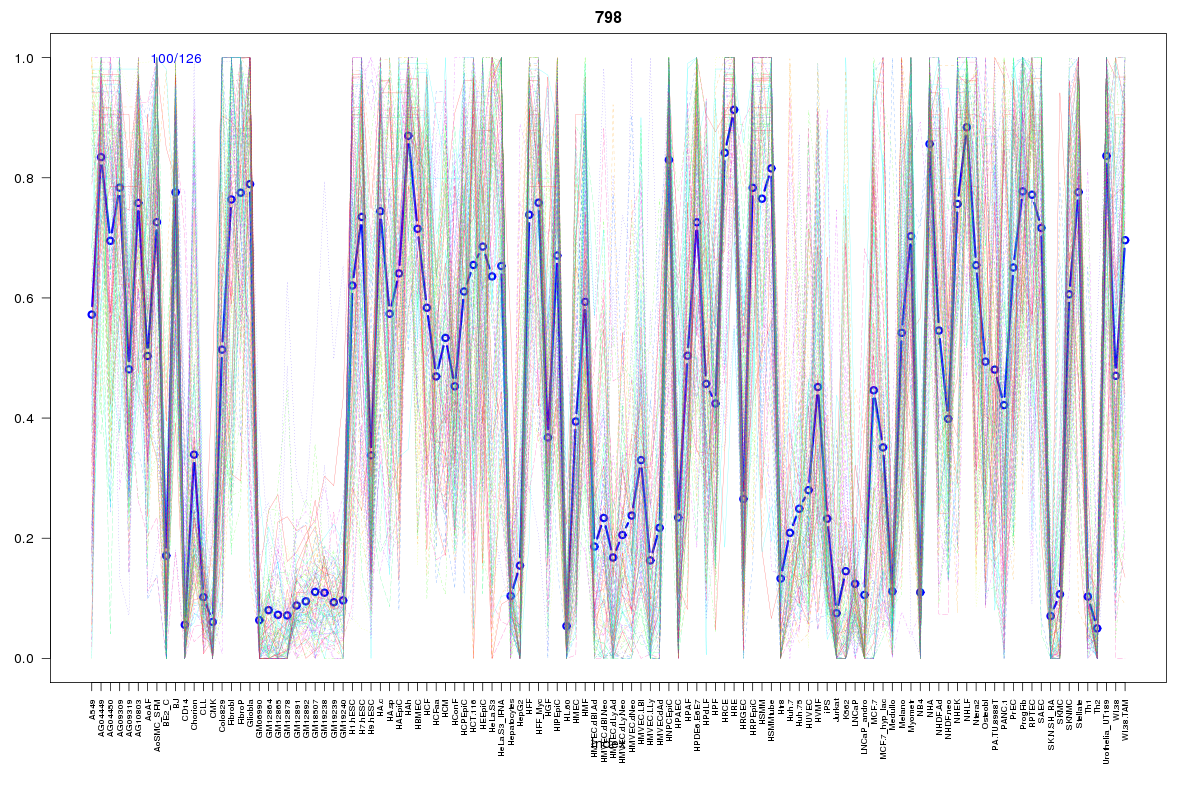
Cluster Hypersensitivity Profile

Genomic Location Trend
These plots show the distribution of the DHS sites surrounding the Transcript Start Site of the nearest gene.
Stats
Number of sites: 126Promoter: 2%
CpG-Island: 0%
Conserved: 42%
Enriched Motifs & Matches
Match Detail: [Jaspar]
|
| ||
|---|---|---|
| Sites: 44/100 | e-val: 3.4e-21 | ||
| Factor | e-val(match) | DB |
| AP1 | 0.00000000056293 | JASPAR |
| NFE2L2 | 0.0000003794 | JASPAR |
| PPARG | 0.0068913 | JASPAR |
| PBX1 | 0.0092151 | JASPAR |
| NR4A2 | 0.011838 | JASPAR |
|
| ||
| Sites: 33/100 | e-val: 0.00000069 | ||
| Factor | e-val(match) | DB |
| TEAD1 | 0.00000000056008 | JASPAR |
| IRF2 | 0.00066932 | JASPAR |
| SPI1 | 0.00086967 | JASPAR |
| RELA | 0.0012889 | JASPAR |
| SPIB | 0.003481 | JASPAR |
|
| ||
| Sites: 16/100 | e-val: 1.5 | ||
| Factor | e-val(match) | DB |
| Pax4 | 0.00000018618 | JASPAR |
| Tal1::Gata1 | 0.00058011 | JASPAR |
| Klf4 | 0.0010518 | JASPAR |
| RREB1 | 0.0016527 | JASPAR |
| Egr1 | 0.0018942 | JASPAR |
BED file downloads
Top 10 Example Regions
| Location | Gene Link | Dist. |
|---|---|---|
| chr7: 150810480-150810630 | TMUB1 | 45.08 |
| chr7: 150810480-150810630 | NOS3 | 45.08 |
| chr10: 33299500-33299650 | AK3P5 | 49.61 |
| chr10: 33299500-33299650 | RP11-462L8.1 | 49.61 |
| chr10: 33299500-33299650 | RP11-462L8.2 | 49.61 |
| chr10: 33299500-33299650 | ITGB1 | 49.61 |
| chr1: 24593060-24593210 | RP11-10N16.2 | 50.8 |
| chr18: 46543600-46543750 | SMAD7 | 51.42 |
| chr11: 35236400-35236550 | RP1-68D18.2 | 60.65 |
| chr1: 31289600-31289750 | RP1-65J11.1 | 62.47 |