SOM cluster: 791
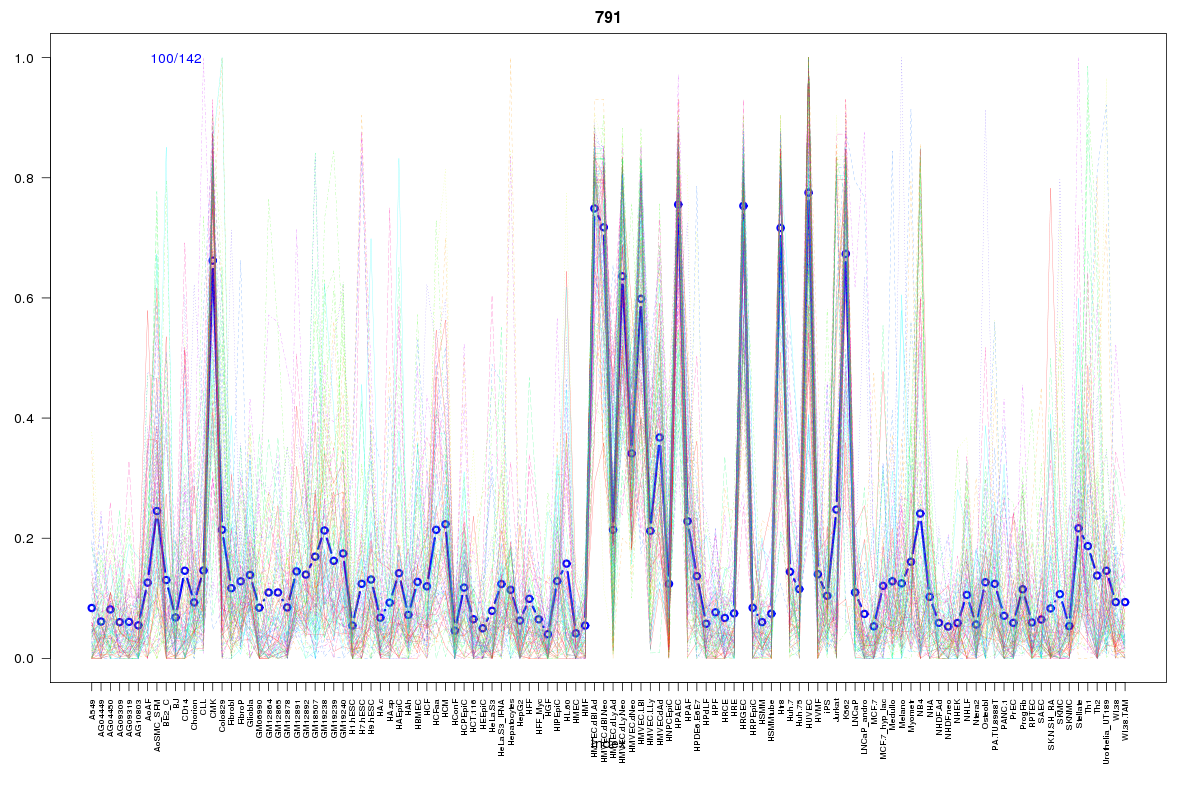
Cluster Hypersensitivity Profile

Genomic Location Trend
These plots show the distribution of the DHS sites surrounding the Transcript Start Site of the nearest gene.
Stats
Number of sites: 142Promoter: 7%
CpG-Island: 3%
Conserved: 46%
Enriched Motifs & Matches
Match Detail: [Jaspar]
|
| ||
|---|---|---|
| Sites: 38/100 | e-val: 3.5e-18 | ||
| Factor | e-val(match) | DB |
| FEV | 0.0000015684 | JASPAR |
| SPIB | 0.0000023428 | JASPAR |
| SPI1 | 0.0000040285 | JASPAR |
| FOXA1 | 0.0000078127 | JASPAR |
| Foxa2 | 0.000042809 | JASPAR |