SOM cluster: 79
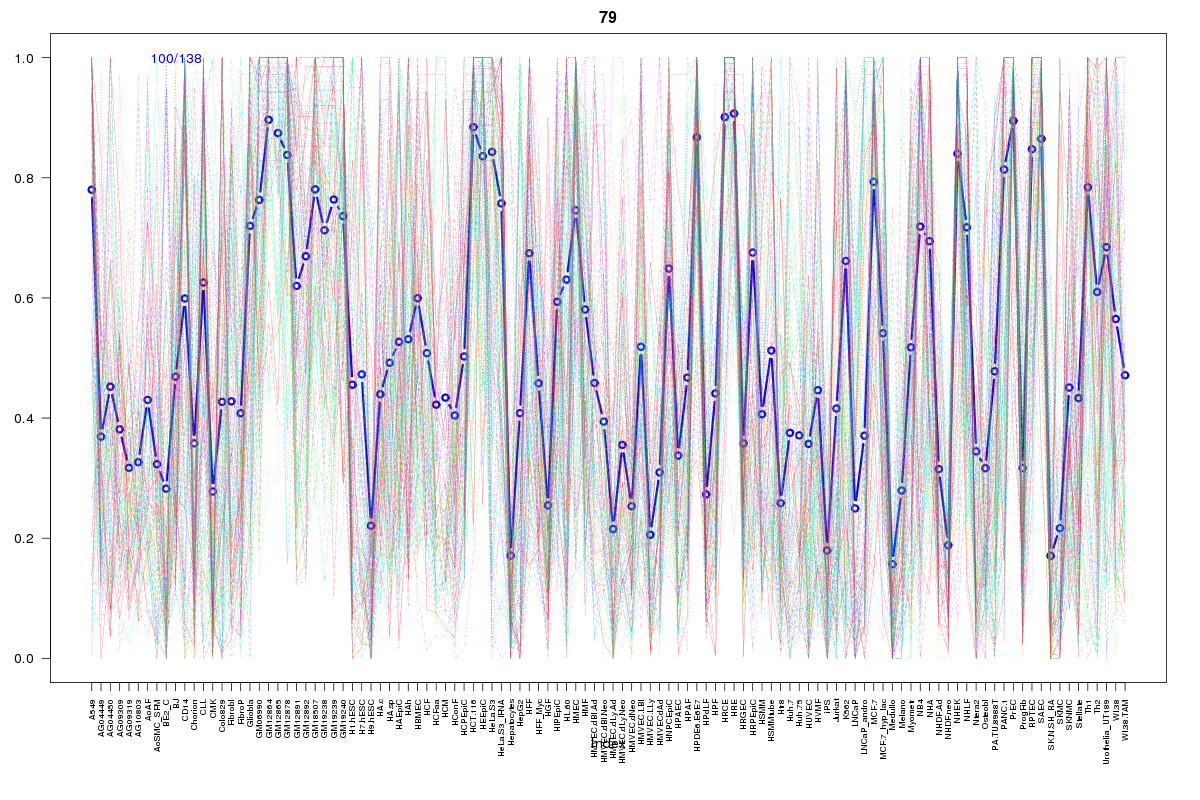
Cluster Hypersensitivity Profile

Genomic Location Trend
These plots show the distribution of the DHS sites surrounding the Transcript Start Site of the nearest gene.
Stats
Number of sites: 138Promoter: 11%
CpG-Island: 4%
Conserved: 50%
Enriched Motifs & Matches
Match Detail: [Jaspar]
|
| ||
|---|---|---|
| Sites: 59/100 | e-val: 5.9e-35 | ||
| Factor | e-val(match) | DB |
| AP1 | 0.0000000010158 | JASPAR |
| NFE2L2 | 0.000000009415 | JASPAR |
| NFE2L1::MafG | 0.00077376 | JASPAR |
| PBX1 | 0.0027154 | JASPAR |
| Pax2 | 0.026809 | JASPAR |
BED file downloads
Top 10 Example Regions
| Location | Gene Link | Dist. |
|---|---|---|
| chr1: 147806500-147806650 | RP11-495P10.5 | 18.35 |
| chr1: 147806500-147806650 | RP11-495P10.8 | 18.35 |
| chr3: 32461840-32461990 | CMTM6 | 53.18 |
| chr3: 32461840-32461990 | CMTM7 | 53.18 |
| chr3: 32461840-32461990 | CMTM8 | 53.18 |
| chr3: 193723040-193723190 | RP11-135A1.3 | 59.16 |
| chr3: 15352280-15352430 | Y_RNA | 63.28 |
| chr19: 51399960-51400110 | CTD-2568A17.5 | 63.91 |
| chr19: 51399960-51400110 | KLK5 | 63.91 |
| chr19: 51399960-51400110 | KLK6 | 63.91 |