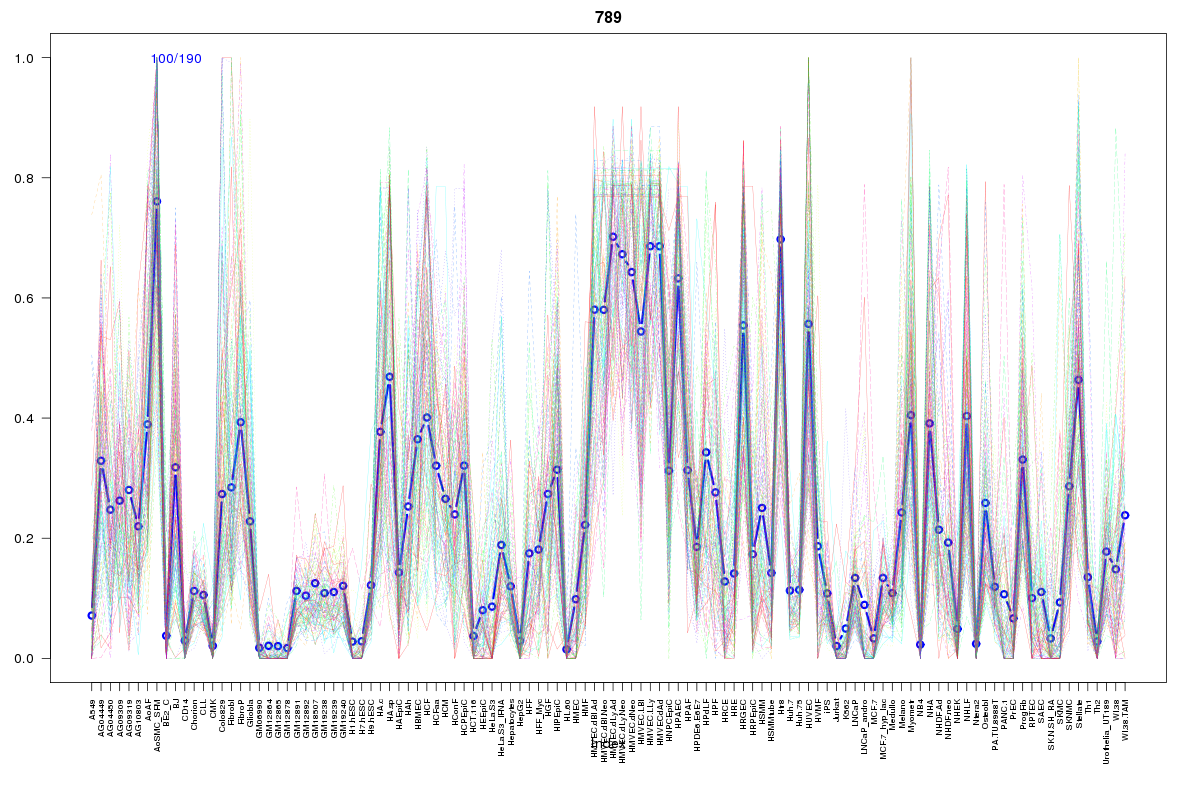
SOM cluster: 789
Cluster Hypersensitivity Profile

Genomic Location Trend
These plots show the distribution of the DHS sites surrounding the Transcript Start Site of the nearest gene.
Stats
Number of sites: 190Promoter: 1%
CpG-Island: 0%
Conserved: 63%
Enriched Motifs & Matches
Match Detail: [Jaspar]
|
| ||
|---|---|---|
| Sites: 83/100 | e-val: 1.4e-23 | ||
| Factor | e-val(match) | DB |
| Foxd3 | 0.000036161 | JASPAR |
| NFATC2 | 0.00023871 | JASPAR |
| Pax4 | 0.00090556 | JASPAR |
| Foxq1 | 0.0011946 | JASPAR |
| Lhx3 | 0.0018036 | JASPAR |
|
| ||
| Sites: 37/100 | e-val: 0.0071 | ||
| Factor | e-val(match) | DB |
| AP1 | 0.000000000091626 | JASPAR |
| NFE2L2 | 0.0000000053416 | JASPAR |
| PPARG | 0.0044974 | JASPAR |
| NFE2L1::MafG | 0.0045074 | JASPAR |
| Foxa2 | 0.013866 | JASPAR |
|
| ||
| Sites: 25/100 | e-val: 0.73 | ||
| Factor | e-val(match) | DB |
| FEV | 0.0000000000011576 | JASPAR |
| ELK4 | 0.000000016732 | JASPAR |
| SPI1 | 0.000000056647 | JASPAR |
| ELF5 | 0.00000010378 | JASPAR |
| Stat3 | 0.0000040916 | JASPAR |
BED file downloads
Top 10 Example Regions
| Location | Gene Link | Dist. |
|---|---|---|
| chr1: 41567840-41567990 | CTPS1 | 41.16 |
| chr22: 19654320-19654470 | TBX1 | 44.68 |
| chr22: 19654320-19654470 | SEPT5 | 44.68 |
| chr11: 109992020-109992170 | ZC3H12C | 48.67 |
| chr3: 140814100-140814250 | RP11-231L11.1 | 51.21 |
| chr13: 65486420-65486570 | LGMNP1 | 52.25 |
| chr13: 53173460-53173610 | HNRNPA1L2 | 53.31 |
| chr9: 3497520-3497670 | RP11-509J21.1 | 53.89 |
| chr13: 99715020-99715170 | DOCK9 | 53.93 |
| chr10: 5986765-5986915 | IL2RA | 54.37 |