SOM cluster: 788
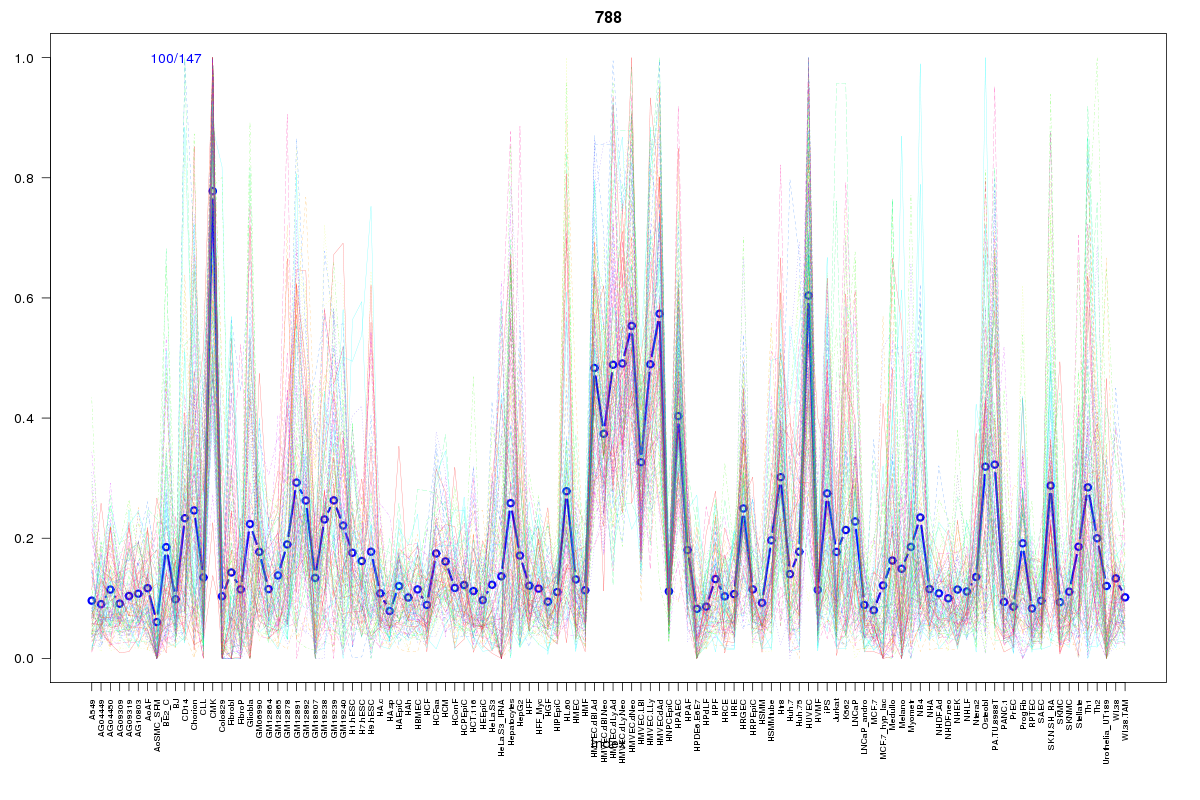
Cluster Hypersensitivity Profile

Genomic Location Trend
These plots show the distribution of the DHS sites surrounding the Transcript Start Site of the nearest gene.
Stats
Number of sites: 147Promoter: 13%
CpG-Island: 19%
Conserved: 57%
Enriched Motifs & Matches
Match Detail: [Jaspar]
|
| ||
|---|---|---|
| Sites: 74/100 | e-val: 0 | ||
| Factor | e-val(match) | DB |
| RREB1 | 0.00000089044 | JASPAR |
| SP1 | 0.000011349 | JASPAR |
| Pax4 | 0.00028628 | JASPAR |
| TFAP2A | 0.0012045 | JASPAR |
| Klf4 | 0.002589 | JASPAR |
|
| ||
| Sites: 66/100 | e-val: 2.2e-26 | ||
| Factor | e-val(match) | DB |
| FEV | 0.000000024554 | JASPAR |
| Stat3 | 0.00000033298 | JASPAR |
| SPI1 | 0.0000014808 | JASPAR |
| ELK4 | 0.0000088088 | JASPAR |
| ELF5 | 0.00010426 | JASPAR |
|
| ||
| Sites: 83/100 | e-val: 5.2e-20 | ||
| Factor | e-val(match) | DB |
| SP1 | 0.00037239 | JASPAR |
| Myf | 0.0010837 | JASPAR |
| INSM1 | 0.0015141 | JASPAR |
| Tcfcp2l1 | 0.0045218 | JASPAR |
| PPARG::RXRA | 0.0054559 | JASPAR |
|
| ||
| Sites: 58/100 | e-val: 0.00000098 | ||
| Factor | e-val(match) | DB |
| Tal1::Gata1 | 0.0011315 | JASPAR |
| NHLH1 | 0.0032932 | JASPAR |
| Myf | 0.0041781 | JASPAR |
| SP1 | 0.017375 | JASPAR |
| Stat3 | 0.033868 | JASPAR |
BED file downloads
Top 10 Example Regions
| Location | Gene Link | Dist. |
|---|---|---|
| chr11: 128418920-128419070 | ETS1 | 45.44 |
| chr19: 802905-803055 | ELANE | 55.06 |
| chr12: 49503960-49504110 | TUBA1C | 55.7 |
| chr12: 49503960-49504110 | PRKAG1 | 55.7 |
| chr12: 49503960-49504110 | LMBR1L | 55.7 |
| chr12: 49503960-49504110 | KMT2D | 55.7 |
| chr17: 7759485-7759635 | AC025335.1 | 58.45 |
| chr17: 7759485-7759635 | TMEM88 | 58.45 |
| chr17: 27912100-27912250 | SSH2 | 59.47 |
| chr22: 18269380-18269530 | BID | 64.3 |