SOM cluster: 769
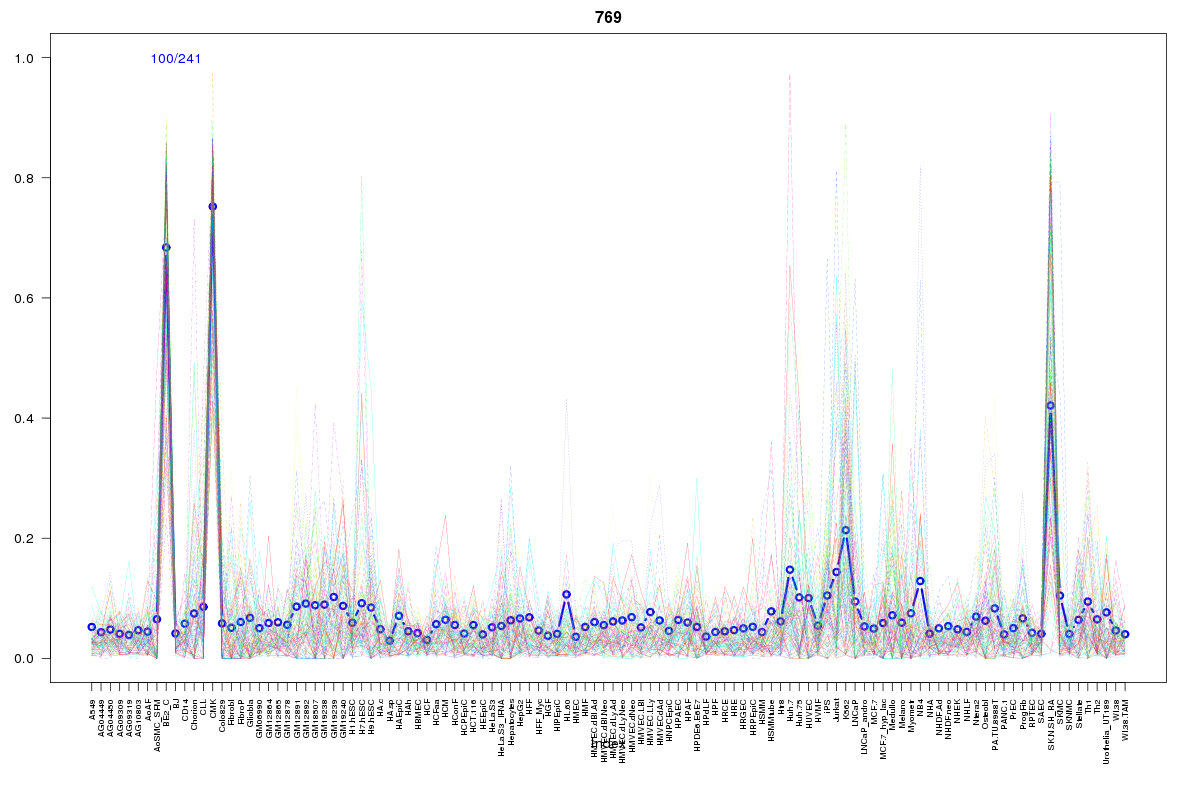
Cluster Hypersensitivity Profile

Genomic Location Trend
These plots show the distribution of the DHS sites surrounding the Transcript Start Site of the nearest gene.
Stats
Number of sites: 241Promoter: 2%
CpG-Island: 2%
Conserved: 36%
Enriched Motifs & Matches
Match Detail: [Jaspar]
|
| ||
|---|---|---|
| Sites: 35/100 | e-val: 1.2e-19 | ||
| Factor | e-val(match) | DB |
| EWSR1-FLI1 | 0.000022646 | JASPAR |
| FEV | 0.000055046 | JASPAR |
| SPI1 | 0.00010978 | JASPAR |
| Stat3 | 0.00036388 | JASPAR |
| ELK4 | 0.00038125 | JASPAR |
|
| ||
| Sites: 37/100 | e-val: 0.0000000000076 | ||
| Factor | e-val(match) | DB |
| Gata1 | 0.00000034471 | JASPAR |
| Evi1 | 0.000008706 | JASPAR |
| Tal1::Gata1 | 0.000016972 | JASPAR |
| SRF | 0.000068328 | JASPAR |
| GATA2 | 0.0063716 | JASPAR |
|
| ||
| Sites: 29/100 | e-val: 0.045 | ||
| Factor | e-val(match) | DB |
| SP1 | 0.000000094733 | JASPAR |
| Pax4 | 0.0000026241 | JASPAR |
| Klf4 | 0.000028597 | JASPAR |
| RREB1 | 0.0015019 | JASPAR |
| Tal1::Gata1 | 0.0091948 | JASPAR |
BED file downloads
Top 10 Example Regions
| Location | Gene Link | Dist. |
|---|---|---|
| chr22: 27679840-27679990 | CTA-929C8.6 | 67.21 |
| chr12: 102457000-102457150 | DRAM1 | 70.65 |
| chr12: 102457000-102457150 | PARPBP | 70.65 |
| chr2: 16106420-16106570 | snoU13 | 71.72 |
| chr2: 16106420-16106570 | MYCNOS | 71.72 |
| chr12: 56637780-56637930 | MYL6 | 72 |
| chr1: 211666080-211666230 | SLC30A1 | 72.78 |
| chr2: 238801220-238801370 | LRRFIP1 | 73.5 |
| chr22: 43618360-43618510 | BIK | 74.48 |
| chr2: 232751140-232751290 | DIS3L2 | 78.21 |