SOM cluster: 752
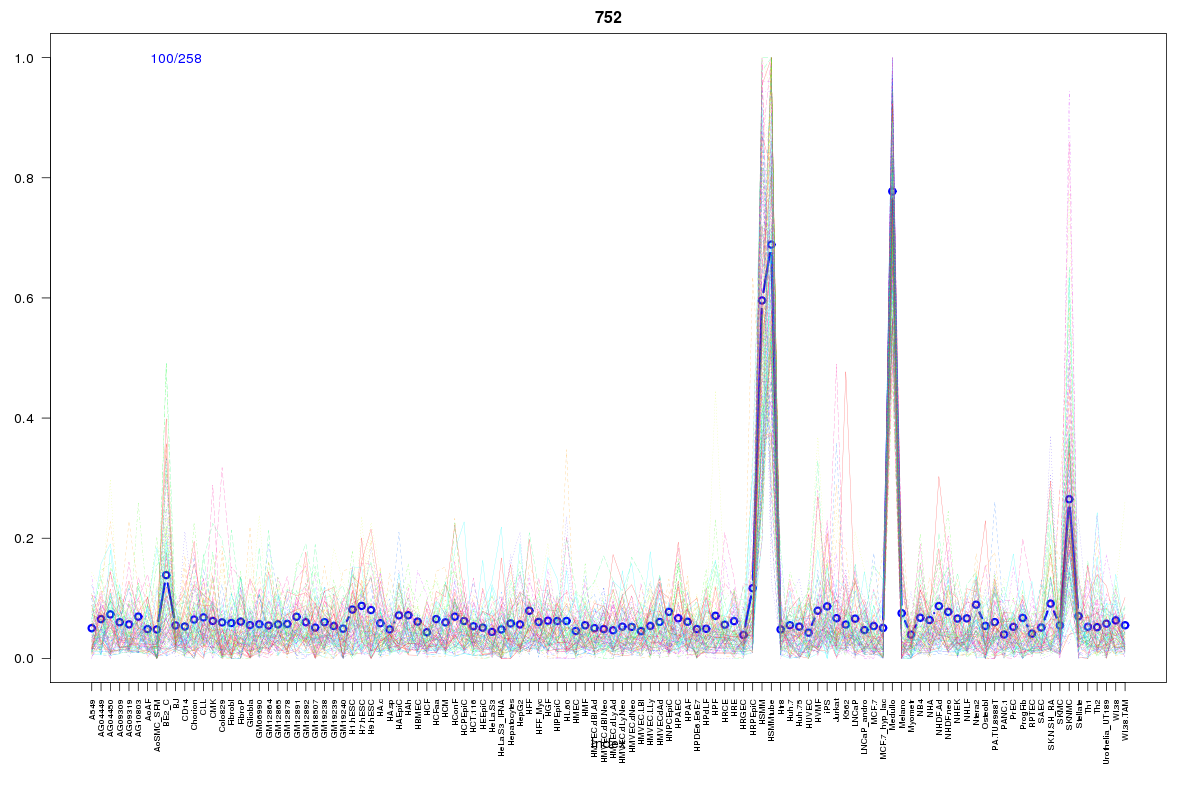
Cluster Hypersensitivity Profile

Genomic Location Trend
These plots show the distribution of the DHS sites surrounding the Transcript Start Site of the nearest gene.
Stats
Number of sites: 258Promoter: 8%
CpG-Island: 1%
Conserved: 55%
Enriched Motifs & Matches
Match Detail: [Jaspar]
|
| ||
|---|---|---|
| Sites: 68/100 | e-val: 0 | ||
| Factor | e-val(match) | DB |
| Myf | 0.0000000016071 | JASPAR |
| NHLH1 | 0.0000070171 | JASPAR |
| TAL1::TCF3 | 0.000049471 | JASPAR |
| Myb | 0.00015722 | JASPAR |
| REST | 0.0025759 | JASPAR |
BED file downloads
Top 10 Example Regions
| Location | Gene Link | Dist. |
|---|---|---|
| chr22: 20237440-20237590 | XXbac-B444P24.8 | 47.98 |
| chr1: 95339780-95339930 | RP4-639F20.1 | 52.55 |
| chr1: 53554680-53554830 | SLC1A7 | 57.86 |
| chr1: 53554680-53554830 | RP11-334A14.8 | 57.86 |
| chr1: 32138845-32138995 | BAI2 | 64.78 |
| chr1: 161992560-161992710 | OLFML2B | 69.54 |
| chr1: 229506540-229506690 | ACTA1 | 71.26 |
| chr17: 10561300-10561450 | MYH3 | 73.12 |
| chr17: 45286240-45286390 | MYL4 | 75.86 |
| chr3: 9737080-9737230 | OGG1 | 76.82 |