SOM cluster: 731
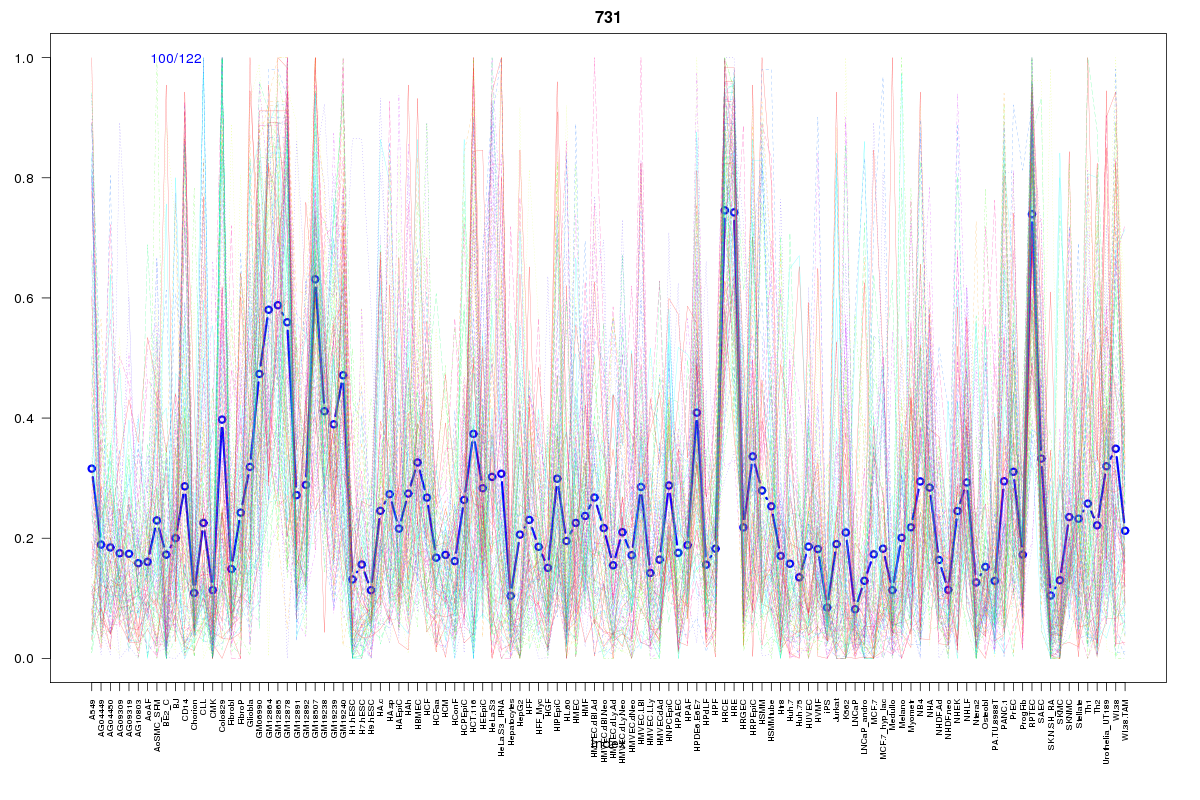
Cluster Hypersensitivity Profile

Genomic Location Trend
These plots show the distribution of the DHS sites surrounding the Transcript Start Site of the nearest gene.
Stats
Number of sites: 122Promoter: 10%
CpG-Island: 3%
Conserved: 35%
Enriched Motifs & Matches
Match Detail: [Jaspar]
|
| ||
|---|---|---|
| Sites: 40/100 | e-val: 2e-17 | ||
| Factor | e-val(match) | DB |
| AP1 | 0.0000000079657 | JASPAR |
| NFE2L2 | 0.00000071134 | JASPAR |
| NFE2L1::MafG | 0.00056919 | JASPAR |
| Lhx3 | 0.0073326 | JASPAR |
| PBX1 | 0.053323 | JASPAR |
BED file downloads
Top 10 Example Regions
| Location | Gene Link | Dist. |
|---|---|---|
| chr5: 172974700-172974850 | CTB-43E15.1 | 41.86 |
| chr8: 101511680-101511830 | KB-1615E4.3 | 47.18 |
| chr1: 70877860-70878010 | CTH | 48.71 |
| chr10: 25190820-25190970 | ENKUR | 53.64 |
| chr21: 37470260-37470410 | AP000688.14 | 58.85 |
| chr21: 37470260-37470410 | AP000688.8 | 58.85 |
| chr21: 37470260-37470410 | AP000688.11 | 58.85 |
| chr21: 37470260-37470410 | SETD4 | 58.85 |
| chr2: 28548980-28549130 | BRE | 60.91 |
| chr11: 94335960-94336110 | RP11-867G2.8 | 62.57 |