SOM cluster: 725
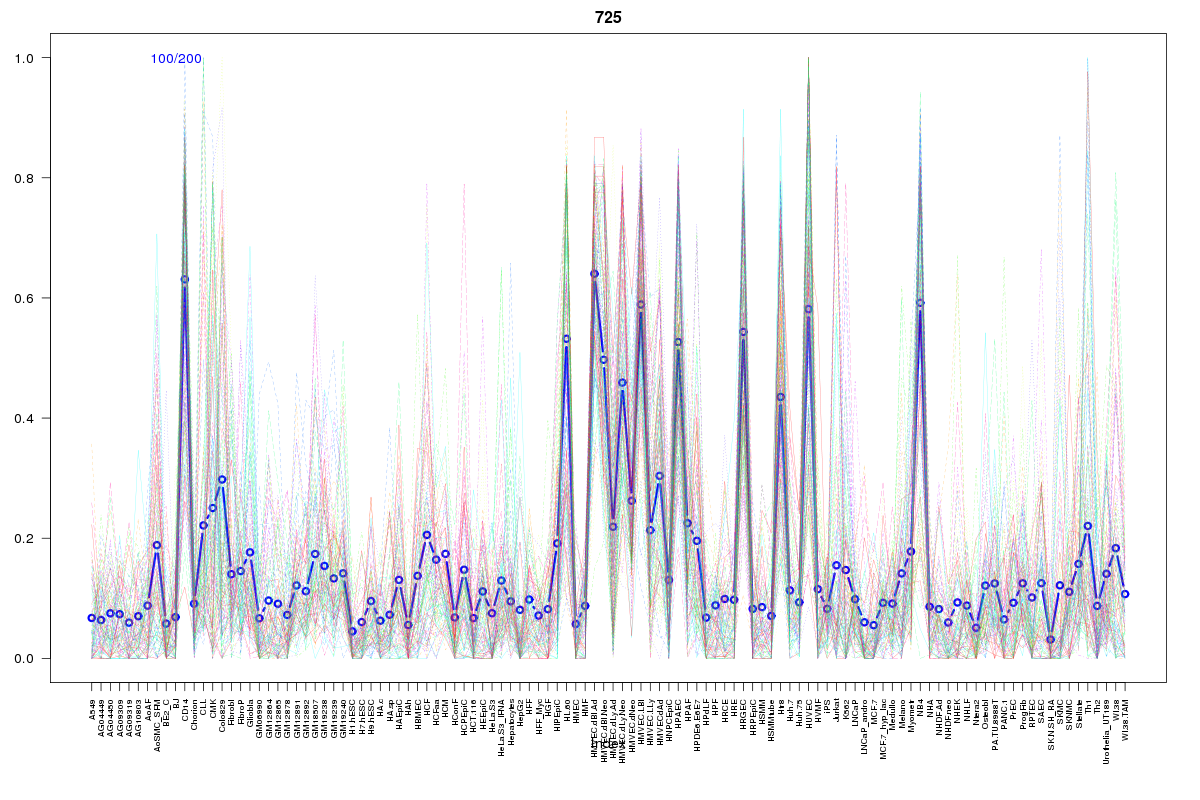
Cluster Hypersensitivity Profile

Genomic Location Trend
These plots show the distribution of the DHS sites surrounding the Transcript Start Site of the nearest gene.
Stats
Number of sites: 200Promoter: 5%
CpG-Island: 0%
Conserved: 36%
Enriched Motifs & Matches
Match Detail: [Jaspar]
|
| ||
|---|---|---|
| Sites: 47/100 | e-val: 2.9e-33 | ||
| Factor | e-val(match) | DB |
| SPI1 | 0.000000039121 | JASPAR |
| SPIB | 0.00000067835 | JASPAR |
| FEV | 0.0000013445 | JASPAR |
| ELF5 | 0.000057847 | JASPAR |
| ELK4 | 0.000070808 | JASPAR |
BED file downloads
Top 10 Example Regions
| Location | Gene Link | Dist. |
|---|---|---|
| chr12: 29360140-29360290 | FAR2 | 50.5 |
| chr12: 29360140-29360290 | RP11-996F15.2 | 50.5 |
| chr1: 192905920-192906070 | RN7SKP126 | 56.83 |
| chr7: 33093980-33094130 | AC074338.5 | 56.93 |
| chr20: 1472000-1472150 | FKBP1A | 64.41 |
| chr20: 1472000-1472150 | SIRPB2 | 64.41 |
| chr2: 69059180-69059330 | ARHGAP25 | 67.47 |
| chr5: 10422100-10422250 | ROPN1L | 67.86 |
| chr5: 10422100-10422250 | RP11-1C1.4 | 67.86 |
| chr9: 117642700-117642850 | TNFSF15 | 68.22 |