SOM cluster: 723
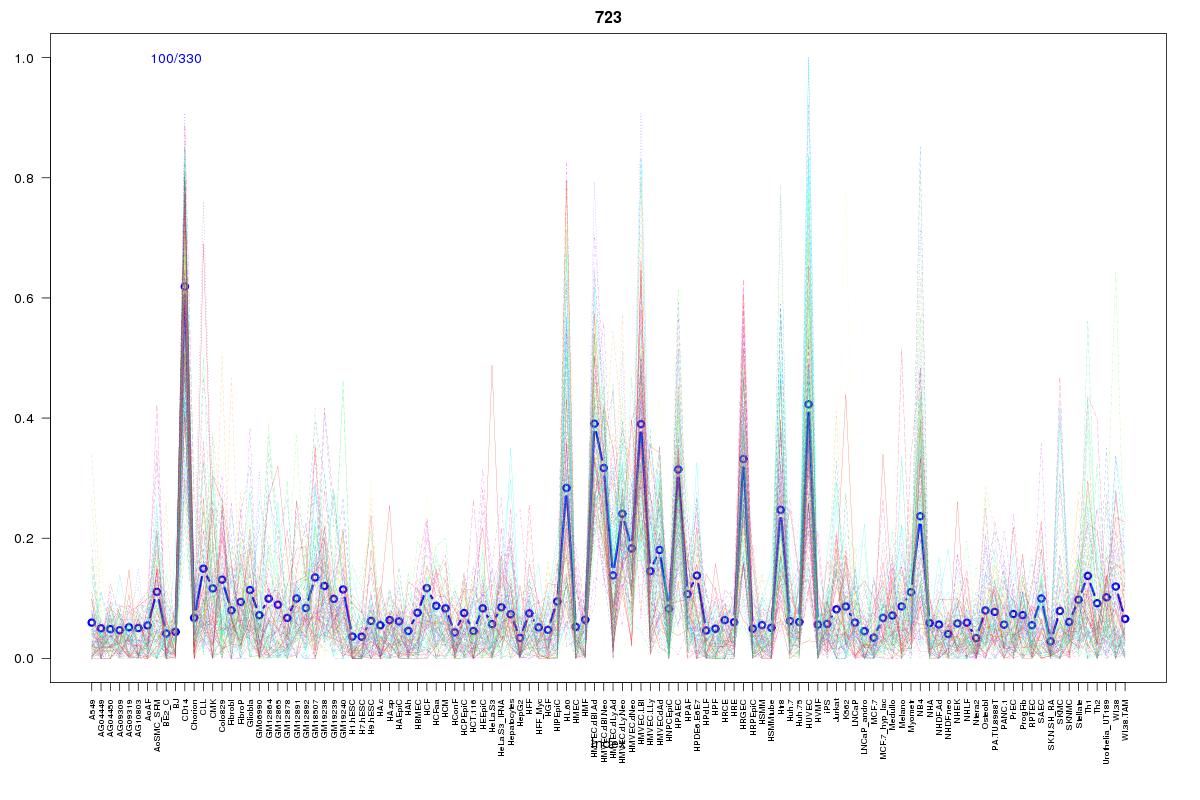
Cluster Hypersensitivity Profile

Genomic Location Trend
These plots show the distribution of the DHS sites surrounding the Transcript Start Site of the nearest gene.
Stats
Number of sites: 330Promoter: 4%
CpG-Island: 0%
Conserved: 23%
Enriched Motifs & Matches
Match Detail: [Jaspar]
|
| ||
|---|---|---|
| Sites: 47/100 | e-val: 1.6e-21 | ||
| Factor | e-val(match) | DB |
| SPI1 | 0.0000000021404 | JASPAR |
| EWSR1-FLI1 | 0.000000034347 | JASPAR |
| FEV | 0.0000011498 | JASPAR |
| ELF5 | 0.0000090117 | JASPAR |
| ELK4 | 0.000061499 | JASPAR |
BED file downloads
Top 10 Example Regions
| Location | Gene Link | Dist. |
|---|---|---|
| chr1: 198888160-198888310 | MIR181A1HG | 32.89 |
| chr1: 198888160-198888310 | MIR181B1 | 32.89 |
| chr1: 53035360-53035510 | FAM159A | 44.44 |
| chr1: 90226200-90226350 | LRRC8C | 45.85 |
| chr1: 90226200-90226350 | RP11-413E1.4 | 45.85 |
| chr4: 6259100-6259250 | PPP2R2C | 47.56 |
| chr5: 132251500-132251650 | SHROOM1 | 52.31 |
| chr3: 183740220-183740370 | HTR3C | 52.46 |
| chr3: 183740220-183740370 | HTR3E | 52.46 |
| chr3: 183740220-183740370 | ABCC5-AS1 | 52.46 |