SOM cluster: 720
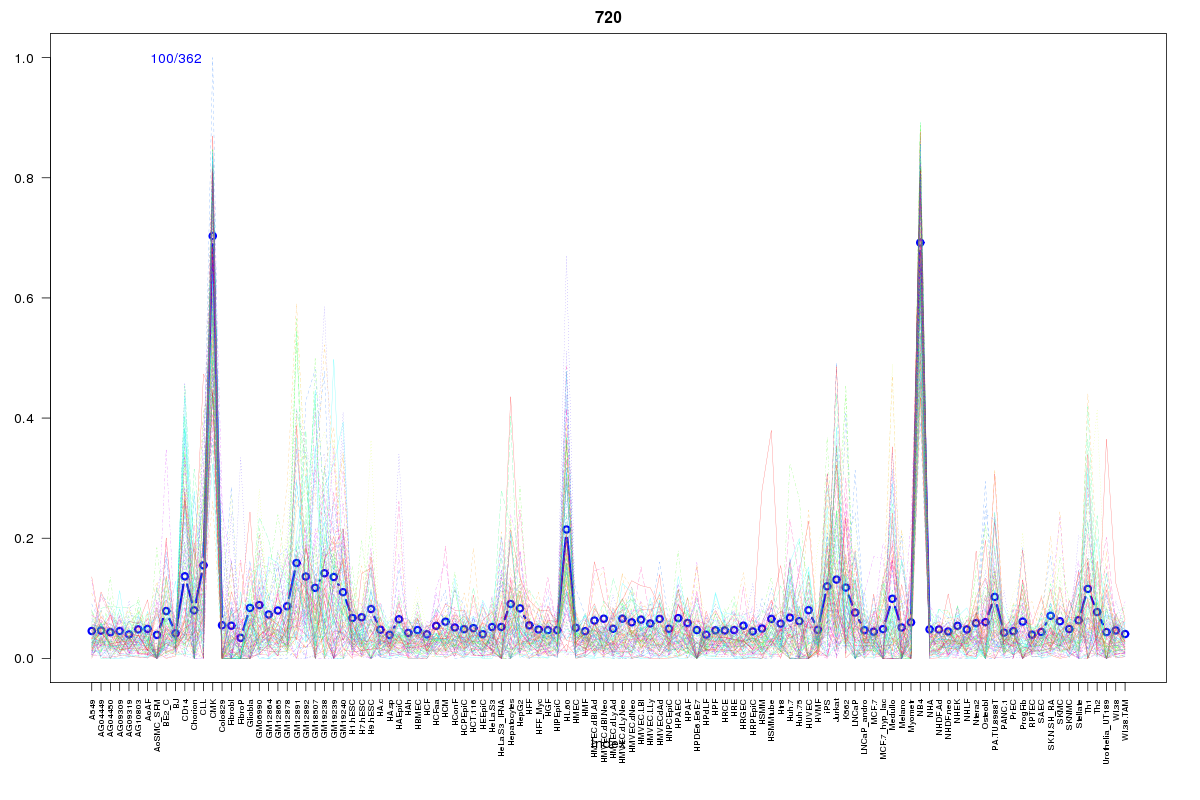
Cluster Hypersensitivity Profile

Genomic Location Trend
These plots show the distribution of the DHS sites surrounding the Transcript Start Site of the nearest gene.
Stats
Number of sites: 362Promoter: 3%
CpG-Island: 1%
Conserved: 16%
Enriched Motifs & Matches
Match Detail: [Jaspar]
|
| ||
|---|---|---|
| Sites: 37/100 | e-val: 0.000000000000025 | ||
| Factor | e-val(match) | DB |
| SPI1 | 0.000000018348 | JASPAR |
| SPIB | 0.000001767 | JASPAR |
| FEV | 0.000018865 | JASPAR |
| ELF5 | 0.00003627 | JASPAR |
| GABPA | 0.000069866 | JASPAR |
BED file downloads
Top 10 Example Regions
| Location | Gene Link | Dist. |
|---|---|---|
| chr11: 65648480-65648630 | DRAP1 | 37.78 |
| chr13: 103427440-103427590 | TEX30 | 38.18 |
| chr13: 103427440-103427590 | snoU13 | 38.18 |
| chr9: 37961460-37961610 | SHB | 41.23 |
| chr9: 37961460-37961610 | DCAF10 | 41.23 |
| chr9: 37961460-37961610 | RP11-613M10.9 | 41.23 |
| chr6: 6725945-6726095 | RP1-80N2.2 | 54.23 |
| chr8: 144480625-144480775 | MAFA | 58.74 |
| chr11: 65647180-65647330 | SART1 | 62.87 |
| chr11: 65647180-65647330 | EFEMP2 | 62.87 |