SOM cluster: 715
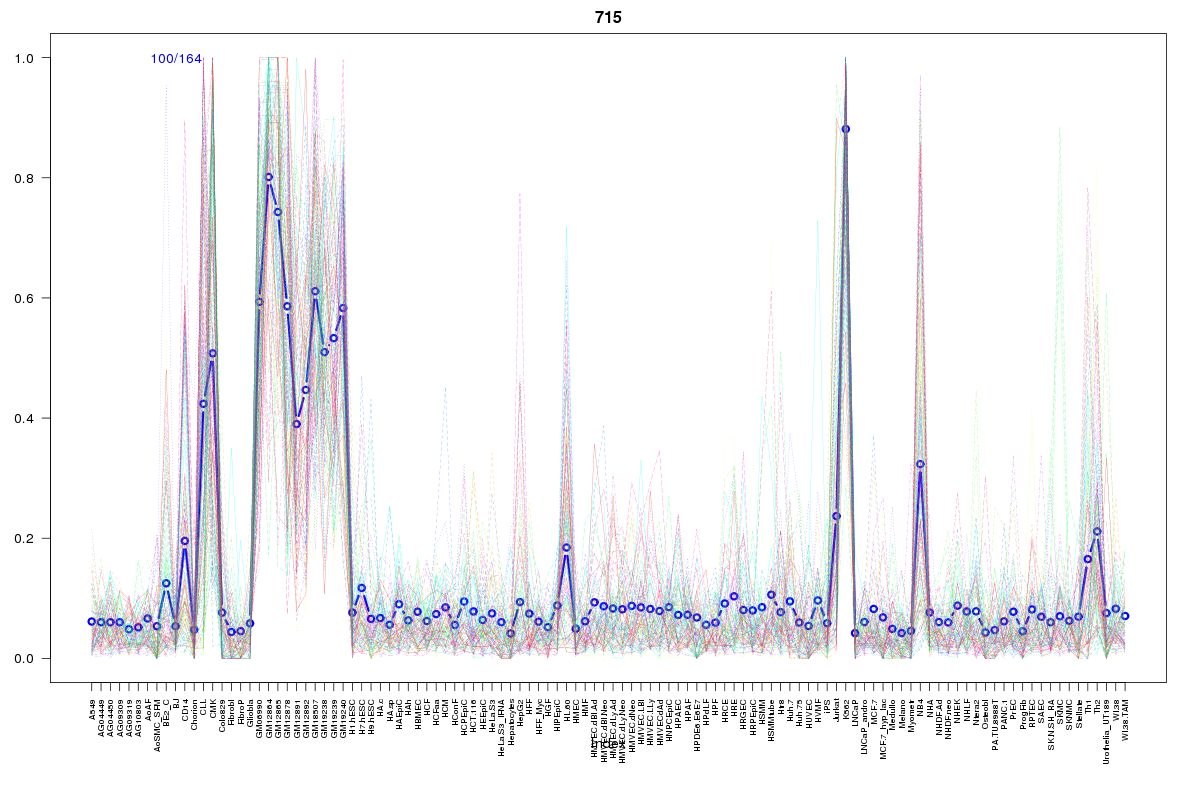
Cluster Hypersensitivity Profile

Genomic Location Trend
These plots show the distribution of the DHS sites surrounding the Transcript Start Site of the nearest gene.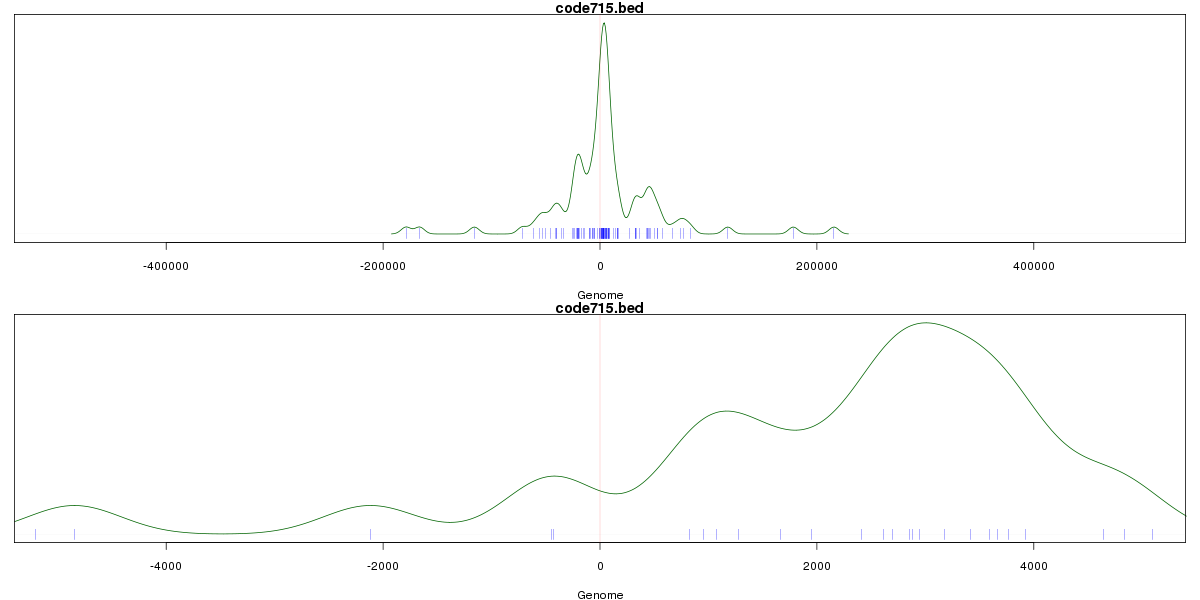
Stats
Number of sites: 164Promoter: 2%
CpG-Island: 0%
Conserved: 38%
Enriched Motifs & Matches
Match Detail: [Jaspar]
|
| ||
|---|---|---|
| Sites: 30/100 | e-val: 0.0000015 | ||
| Factor | e-val(match) | DB |
| SPI1 | 0.0000000016125 | JASPAR |
| SPIB | 0.000000073411 | JASPAR |
| FEV | 0.0000043832 | JASPAR |
| ELF5 | 0.000017881 | JASPAR |
| ELK4 | 0.000018583 | JASPAR |
BED file downloads
Top 10 Example Regions
| Location | Gene Link | Dist. |
|---|---|---|
| chr1: 93499420-93499570 | MTF2 | 32.97 |
| chr4: 48214340-48214490 | TEC | 48.32 |
| chr1: 154832780-154832930 | KCNN3 | 57.8 |
| chr1: 154832780-154832930 | PMVK | 57.8 |
| chr1: 159892040-159892190 | LINC01133 | 60.89 |
| chr1: 159892040-159892190 | C1orf204 | 60.89 |
| chr10: 22955500-22955650 | PIP4K2A | 61.36 |
| chr22: 39861160-39861310 | MGAT3 | 65.41 |
| chr22: 39861160-39861310 | RPS19BP1 | 65.41 |
| chr22: 39861160-39861310 | MIEF1 | 65.41 |