SOM cluster: 700
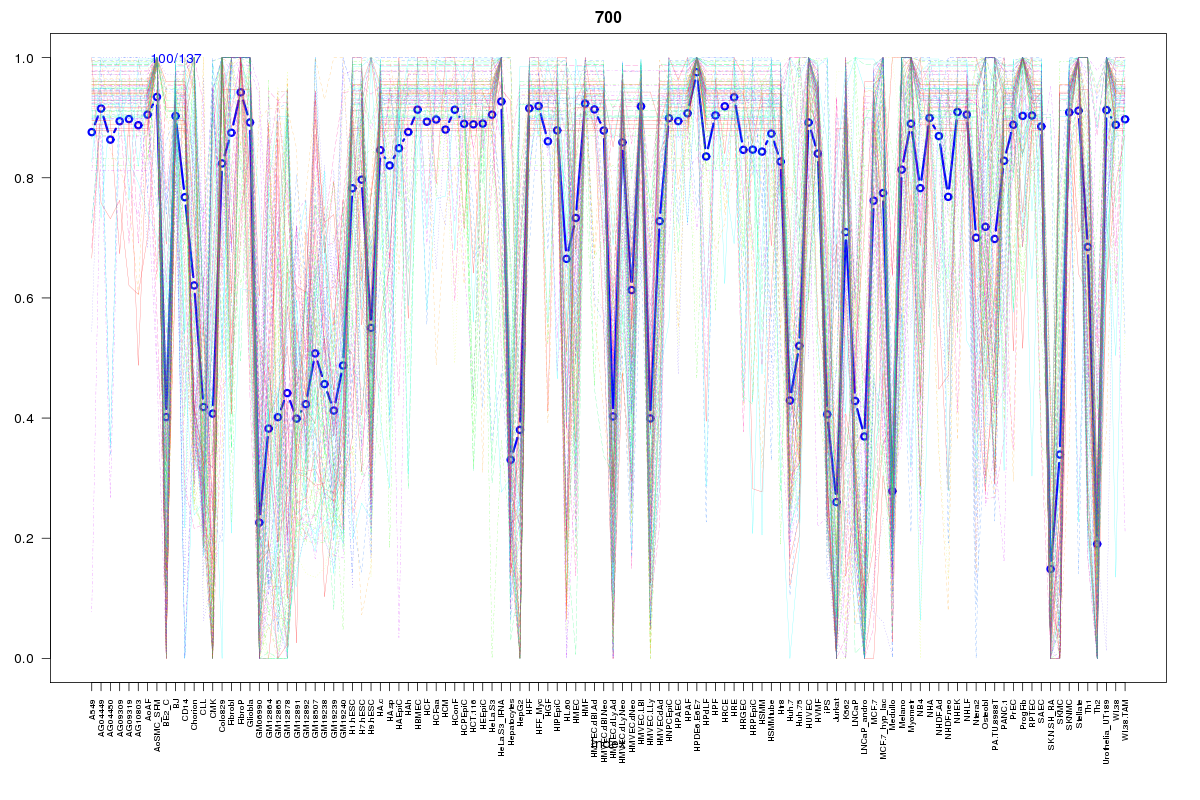
Cluster Hypersensitivity Profile

Genomic Location Trend
These plots show the distribution of the DHS sites surrounding the Transcript Start Site of the nearest gene.
Stats
Number of sites: 137Promoter: 13%
CpG-Island: 3%
Conserved: 75%
Enriched Motifs & Matches
Match Detail: [Jaspar]
|
| ||
|---|---|---|
| Sites: 78/100 | e-val: 0 | ||
| Factor | e-val(match) | DB |
| NFE2L2 | 0.00000000000019962 | JASPAR |
| AP1 | 0.00000000057369 | JASPAR |
| NFE2L1::MafG | 0.0011005 | JASPAR |
| Pax2 | 0.0024002 | JASPAR |
| PPARG | 0.00304 | JASPAR |
|
| ||
| Sites: 35/100 | e-val: 0.000000000000043 | ||
| Factor | e-val(match) | DB |
| EWSR1-FLI1 | 0.00000000028024 | JASPAR |
| SP1 | 0.000033629 | JASPAR |
| Pax4 | 0.00046019 | JASPAR |
| MZF1_5-13 | 0.0020564 | JASPAR |
| SPI1 | 0.0090811 | JASPAR |
BED file downloads
Top 10 Example Regions
| Location | Gene Link | Dist. |
|---|---|---|
| chr1: 151512160-151512310 | TUFT1 | 42.49 |
| chr9: 130324240-130324390 | LRSAM1 | 43.5 |
| chr9: 130324240-130324390 | STXBP1 | 43.5 |
| chr1: 203643380-203643530 | SNORA77 | 56.33 |
| chr1: 203643380-203643530 | ATP2B4 | 56.33 |
| chr1: 8933720-8933870 | RNU6-304P | 58.37 |
| chr3: 146262600-146262750 | PLSCR1 | 61.87 |
| chr2: 55278380-55278530 | RNU6-433P | 62.04 |
| chr2: 55278380-55278530 | EML6 | 62.04 |
| chr2: 55278380-55278530 | RTN4 | 62.04 |