SOM cluster: 697
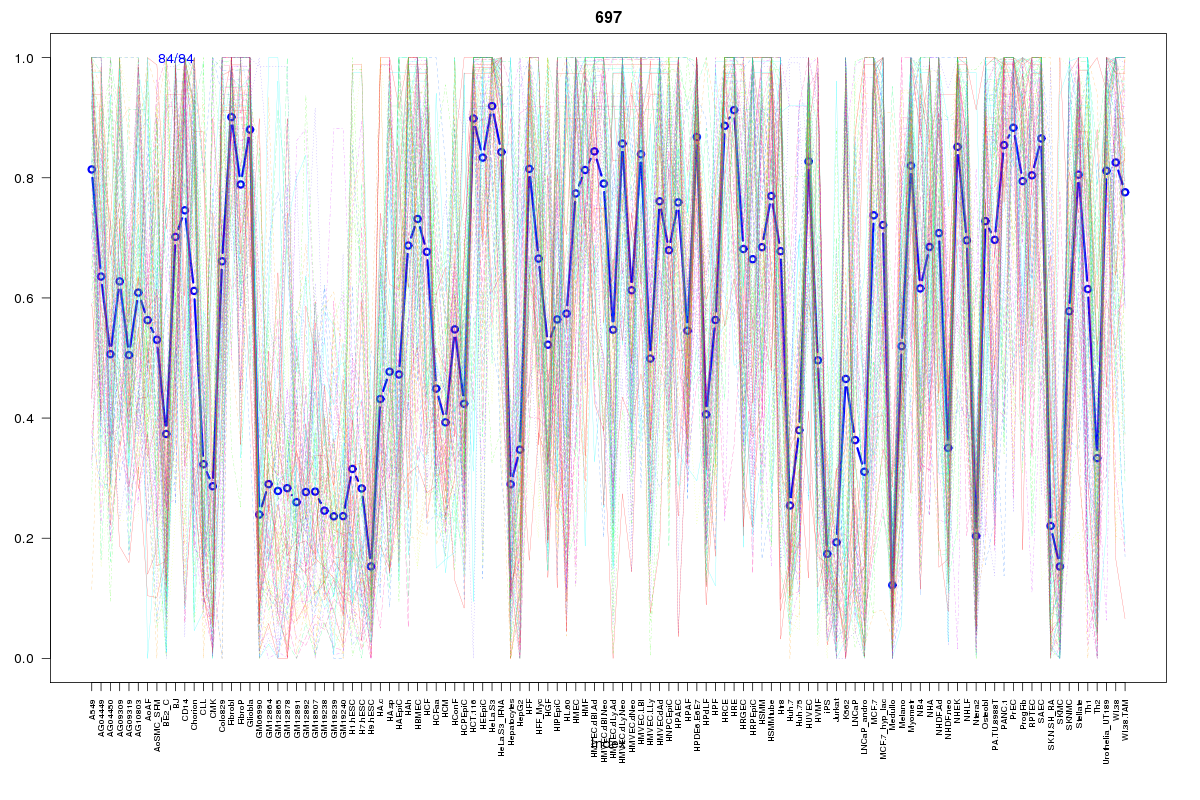
Cluster Hypersensitivity Profile

Genomic Location Trend
These plots show the distribution of the DHS sites surrounding the Transcript Start Site of the nearest gene.
Stats
Number of sites: 84Promoter: 12%
CpG-Island: 0%
Conserved: 49%
Enriched Motifs & Matches
Match Detail: [Jaspar]
|
| ||
|---|---|---|
| Sites: 65/84 | e-val: 0 | ||
| Factor | e-val(match) | DB |
| AP1 | 0.00000000052682 | JASPAR |
| NFE2L2 | 0.0000000013318 | JASPAR |
| NFE2L1::MafG | 0.0012624 | JASPAR |
| Pax2 | 0.0030579 | JASPAR |
| PPARG | 0.0043174 | JASPAR |
BED file downloads
Top 10 Example Regions
| Location | Gene Link | Dist. |
|---|---|---|
| chr1: 149911320-149911470 | MTMR11 | 23.77 |
| chr17: 17861880-17862030 | TOM1L2 | 35.36 |
| chr17: 17861880-17862030 | GID4 | 35.36 |
| chr17: 38257520-38257670 | CSF3 | 48.23 |
| chr17: 38257520-38257670 | NR1D1 | 48.23 |
| chr6: 33558080-33558230 | ITPR3 | 49.69 |
| chr6: 33558080-33558230 | RN7SL26P | 49.69 |
| chr11: 65323420-65323570 | LTBP3 | 58.37 |
| chr3: 196065400-196065550 | AC069257.6 | 59.32 |
| chr3: 196065400-196065550 | RN7SL738P | 59.32 |