SOM cluster: 690
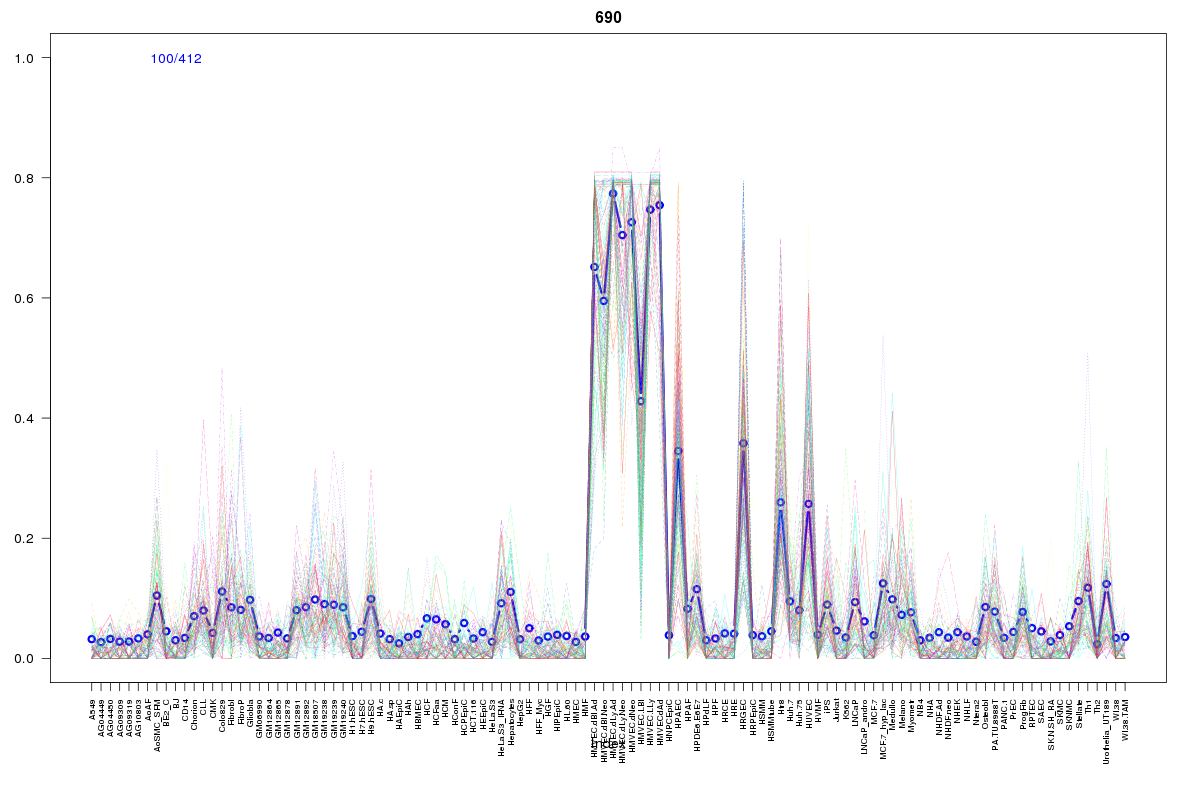
Cluster Hypersensitivity Profile

Genomic Location Trend
These plots show the distribution of the DHS sites surrounding the Transcript Start Site of the nearest gene.
Stats
Number of sites: 412Promoter: 1%
CpG-Island: 0%
Conserved: 48%
Enriched Motifs & Matches
Match Detail: [Jaspar]
|
| ||
|---|---|---|
| Sites: 21/100 | e-val: 0.000013 | ||
| Factor | e-val(match) | DB |
| FEV | 0.00000020332 | JASPAR |
| ELK4 | 0.00011814 | JASPAR |
| Stat3 | 0.00063671 | JASPAR |
| SPI1 | 0.00068688 | JASPAR |
| SPIB | 0.000759 | JASPAR |
|
| ||
| Sites: 7/100 | e-val: 0.98 | ||
| Factor | e-val(match) | DB |
| FEV | 0.000011257 | JASPAR |
| SPI1 | 0.000015633 | JASPAR |
| NFATC2 | 0.00073843 | JASPAR |
| RELA | 0.00074661 | JASPAR |
| ELF5 | 0.0017007 | JASPAR |
BED file downloads
Top 10 Example Regions
| Location | Gene Link | Dist. |
|---|---|---|
| chr7: 135204260-135204410 | CNOT4 | 32.71 |
| chr17: 61793900-61794050 | DDX42 | 35.84 |
| chr17: 61793900-61794050 | RP11-51F16.8 | 35.84 |
| chr5: 147343580-147343730 | SCGB3A2 | 44.26 |
| chr8: 135853260-135853410 | RP11-1057B8.2 | 46.78 |
| chr3: 123953780-123953930 | KALRN | 47.92 |
| chr7: 50886080-50886230 | GRB10 | 48.58 |
| chr1: 46615880-46616030 | PIK3R3 | 48.87 |
| chr17: 61657060-61657210 | ACE | 52.35 |
| chr17: 61657060-61657210 | MAP3K3 | 52.35 |