SOM cluster: 683
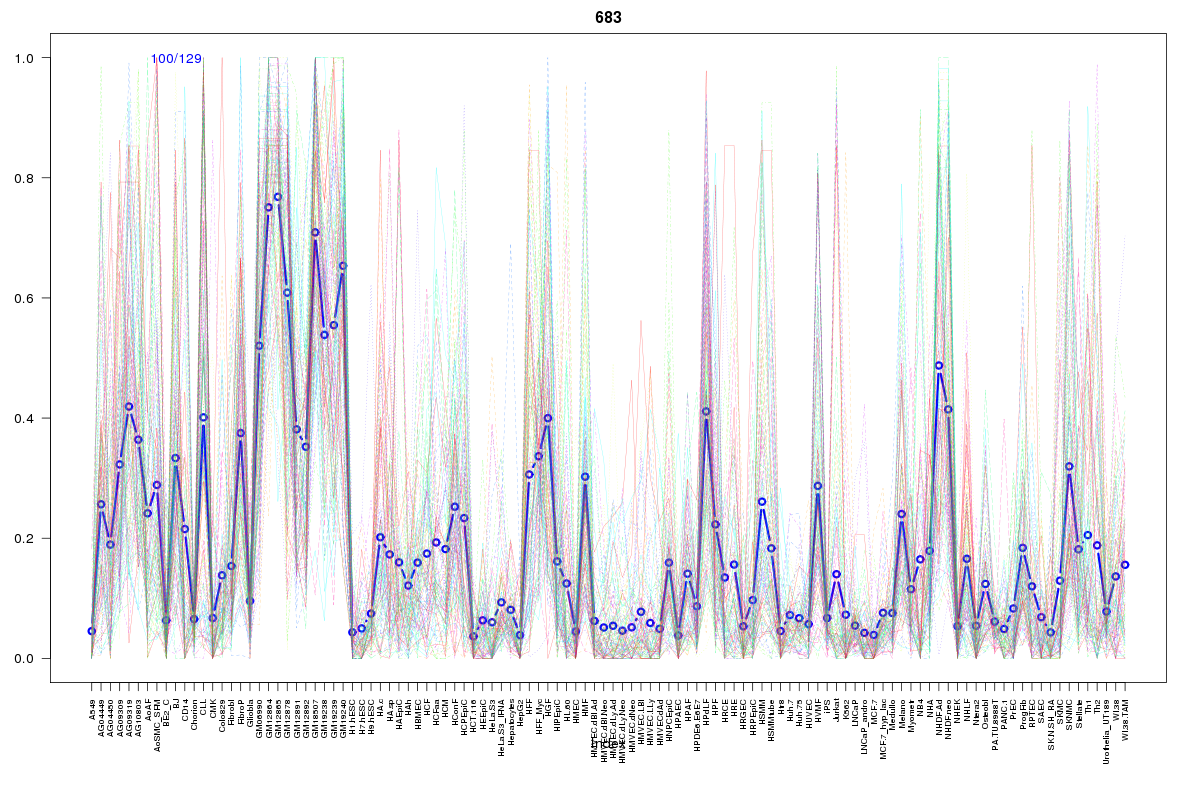
Cluster Hypersensitivity Profile

Genomic Location Trend
These plots show the distribution of the DHS sites surrounding the Transcript Start Site of the nearest gene.
Stats
Number of sites: 129Promoter: 2%
CpG-Island: 0%
Conserved: 52%
Enriched Motifs & Matches
Match Detail: [Jaspar]
|
| ||
|---|---|---|
| Sites: 36/100 | e-val: 0.0000000000001 | ||
| Factor | e-val(match) | DB |
| IRF1 | 0.000000000000090039 | JASPAR |
| IRF2 | 0.0000000000022907 | JASPAR |
| Foxa2 | 0.00086513 | JASPAR |
| FOXO3 | 0.00090602 | JASPAR |
| FOXA1 | 0.0009716 | JASPAR |
BED file downloads
Top 10 Example Regions
| Location | Gene Link | Dist. |
|---|---|---|
| chr17: 38755580-38755730 | CCR7 | 24.87 |
| chr17: 38755580-38755730 | KRT24 | 24.87 |
| chr13: 50028940-50029090 | PHF11 | 57.96 |
| chr13: 50028940-50029090 | SETDB2 | 57.96 |
| chr5: 158202380-158202530 | EBF1 | 62.03 |
| chrX: 112095200-112095350 | AMOT | 63.53 |
| chr3: 16545840-16545990 | DAZL | 65.85 |
| chr3: 16545840-16545990 | RFTN1 | 65.85 |
| chr18: 56317440-56317590 | MALT1 | 69.79 |
| chr9: 127027340-127027490 | RP11-121A14.3 | 74.28 |