SOM cluster: 671
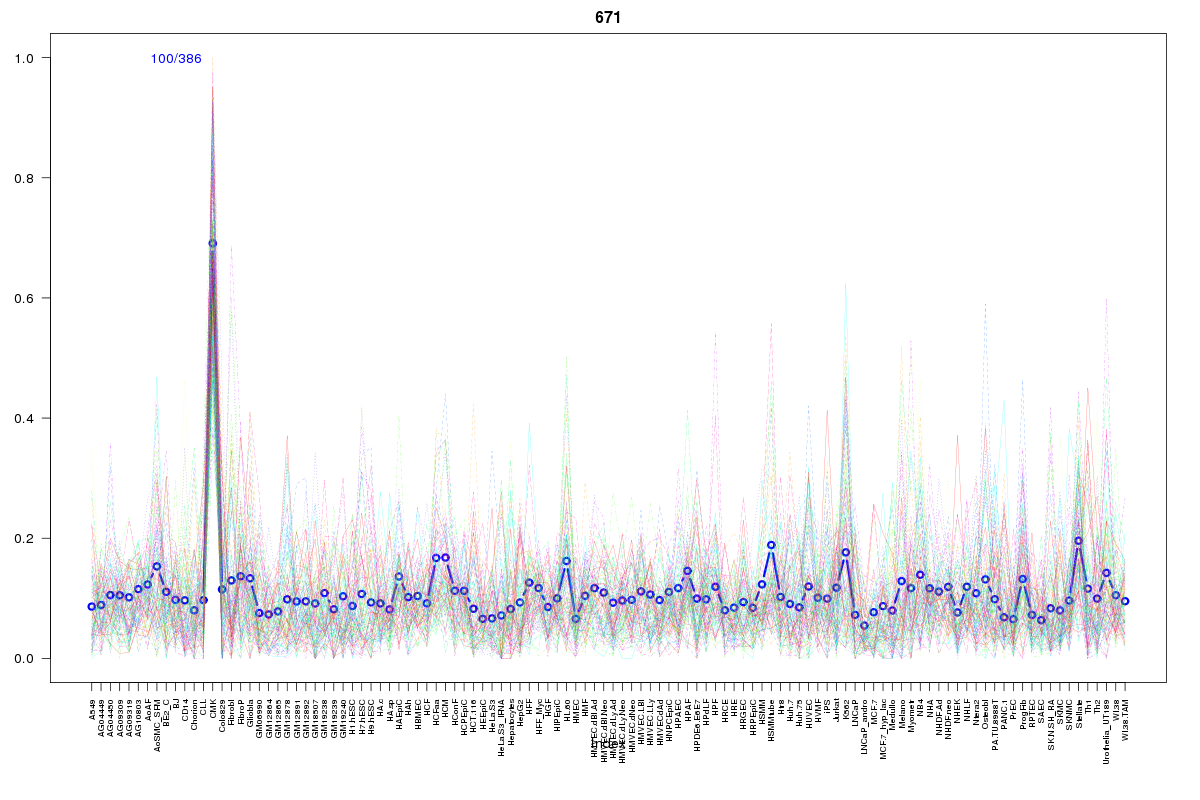
Cluster Hypersensitivity Profile

Genomic Location Trend
These plots show the distribution of the DHS sites surrounding the Transcript Start Site of the nearest gene.
Stats
Number of sites: 386Promoter: 14%
CpG-Island: 4%
Conserved: 36%
Enriched Motifs & Matches
Match Detail: [Jaspar]
|
| ||
|---|---|---|
| Sites: 29/100 | e-val: 0.000000000000031 | ||
| Factor | e-val(match) | DB |
| EWSR1-FLI1 | 0.00000000000015776 | JASPAR |
| Pax4 | 0.00000056816 | JASPAR |
| SP1 | 0.00000431 | JASPAR |
| SPI1 | 0.0000229 | JASPAR |
| FEV | 0.0022677 | JASPAR |
|
| ||
| Sites: 26/100 | e-val: 0.000000097 | ||
| Factor | e-val(match) | DB |
| EWSR1-FLI1 | 0.000000011426 | JASPAR |
| SP1 | 0.000013426 | JASPAR |
| Tal1::Gata1 | 0.00014962 | JASPAR |
| Pax4 | 0.0006246 | JASPAR |
| RXR::RAR_DR5 | 0.0012102 | JASPAR |
BED file downloads
Top 10 Example Regions
| Location | Gene Link | Dist. |
|---|---|---|
| chr19: 3156040-3156190 | CELF5 | 55.88 |
| chr1: 145443020-145443170 | TXNIP | 55.88 |
| chr11: 65210540-65210690 | FRMD8 | 58.49 |
| chr6: 32077080-32077230 | TNXB | 58.88 |
| chr1: 54869425-54869575 | RP4-705F19.1 | 64.69 |
| chr3: 37499260-37499410 | ITGA9 | 65.67 |
| chr6: 41907800-41907950 | BYSL | 68.17 |
| chr6: 41907800-41907950 | CCND3 | 68.17 |
| chr19: 11998340-11998490 | ZNF439 | 68.27 |
| chr19: 11998340-11998490 | ZNF69 | 68.27 |