SOM cluster: 668
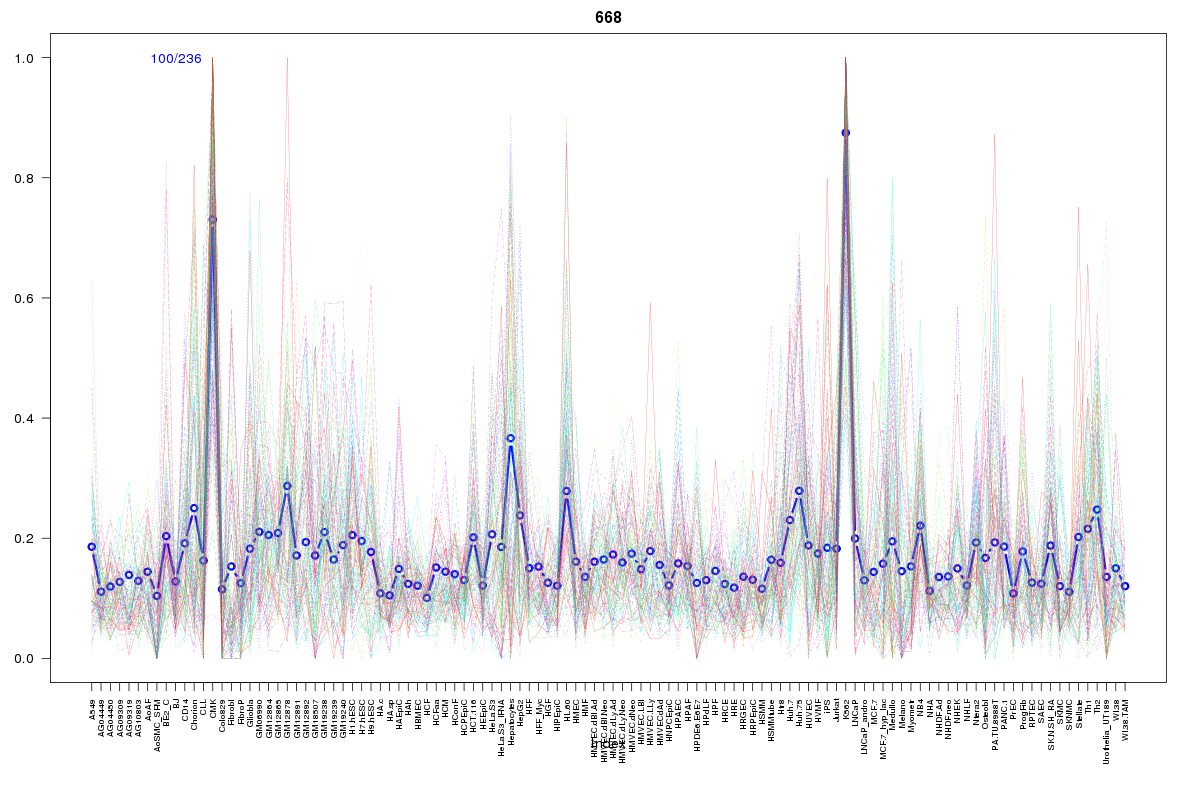
Cluster Hypersensitivity Profile

Genomic Location Trend
These plots show the distribution of the DHS sites surrounding the Transcript Start Site of the nearest gene.
Stats
Number of sites: 236Promoter: 18%
CpG-Island: 16%
Conserved: 45%
Enriched Motifs & Matches
Match Detail: [Jaspar]
|
| ||
|---|---|---|
| Sites: 53/100 | e-val: 8.3e-31 | ||
| Factor | e-val(match) | DB |
| SP1 | 0.000000019424 | JASPAR |
| Pax4 | 0.00000026445 | JASPAR |
| RREB1 | 0.000001431 | JASPAR |
| Tal1::Gata1 | 0.00051424 | JASPAR |
| Klf4 | 0.00055025 | JASPAR |
|
| ||
| Sites: 47/100 | e-val: 0.00000095 | ||
| Factor | e-val(match) | DB |
| SP1 | 0.00011887 | JASPAR |
| Tal1::Gata1 | 0.0001597 | JASPAR |
| Pax4 | 0.002532 | JASPAR |
| EWSR1-FLI1 | 0.018903 | JASPAR |
| SPI1 | 0.033417 | JASPAR |
BED file downloads
Top 10 Example Regions
| Location | Gene Link | Dist. |
|---|---|---|
| chr9: 138398280-138398430 | PPP1R26 | 32.98 |
| chr7: 150101680-150101830 | REPIN1 | 43.8 |
| chr7: 150101680-150101830 | ZNF775 | 43.8 |
| chr19: 18393640-18393790 | PDE4C | 51.11 |
| chr19: 18393640-18393790 | LSM4 | 51.11 |
| chr19: 18393640-18393790 | RN7SL513P | 51.11 |
| chr19: 17006825-17006975 | F2RL3 | 53.97 |
| chr17: 40832620-40832770 | TUBG1 | 56.01 |
| chr17: 40832620-40832770 | VPS25 | 56.01 |
| chr17: 40832620-40832770 | FAM134C | 56.01 |