SOM cluster: 663
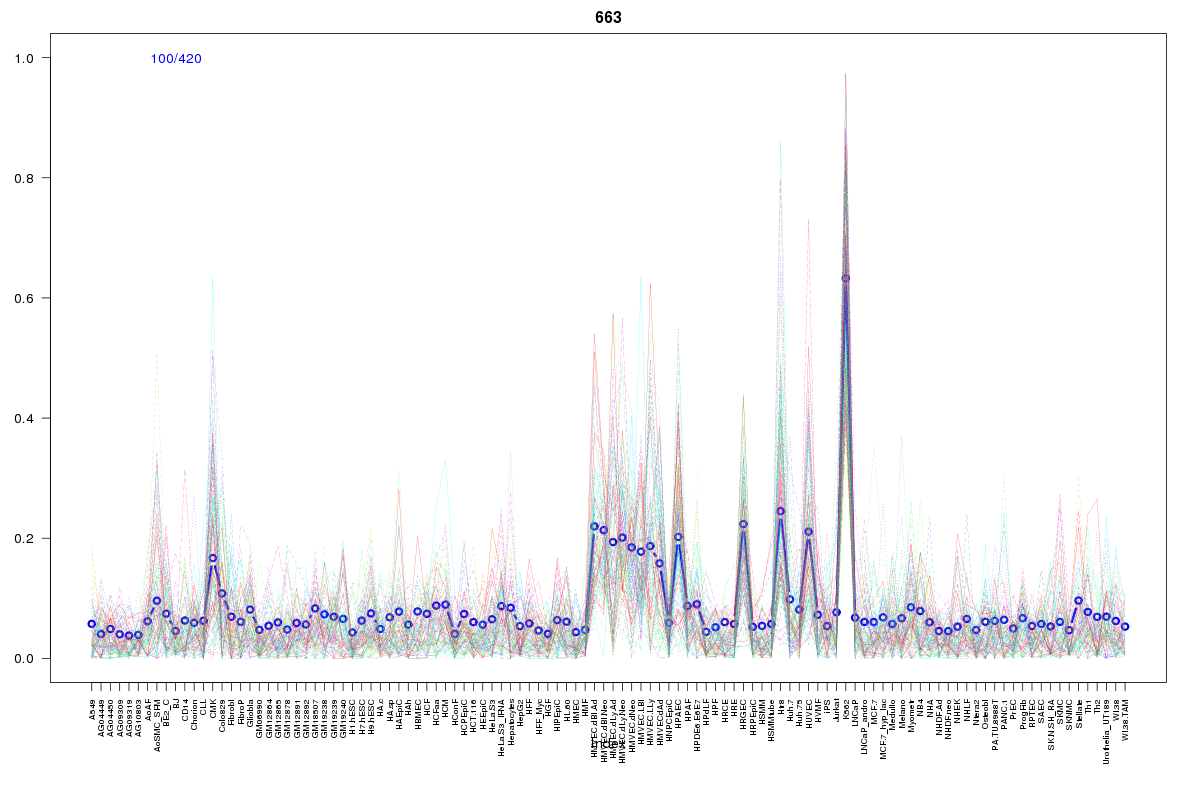
Cluster Hypersensitivity Profile

Genomic Location Trend
These plots show the distribution of the DHS sites surrounding the Transcript Start Site of the nearest gene.
Stats
Number of sites: 420Promoter: 3%
CpG-Island: 0%
Conserved: 23%
Enriched Motifs & Matches
Match Detail: [Jaspar]
|
| ||
|---|---|---|
| Sites: 25/100 | e-val: 0.00000084 | ||
| Factor | e-val(match) | DB |
| FEV | 0.000022268 | JASPAR |
| SPIB | 0.001106 | JASPAR |
| EWSR1-FLI1 | 0.0017512 | JASPAR |
| NFATC2 | 0.003779 | JASPAR |
| SPI1 | 0.0099228 | JASPAR |
|
| ||
| Sites: 30/100 | e-val: 0.00024 | ||
| Factor | e-val(match) | DB |
| Gata1 | 0.000000044699 | JASPAR |
| Evi1 | 0.00000088838 | JASPAR |
| Tal1::Gata1 | 0.0004308 | JASPAR |
| GATA2 | 0.0039164 | JASPAR |
| GATA3 | 0.012065 | JASPAR |
BED file downloads
Top 10 Example Regions
| Location | Gene Link | Dist. |
|---|---|---|
| chr8: 55063900-55064050 | MRPL15 | 47.37 |
| chr6: 10519000-10519150 | RP11-360O19.1 | 47.85 |
| chr3: 46448405-46448555 | CCRL2 | 55.54 |
| chr17: 75159060-75159210 | RNU4-47P | 55.75 |
| chr17: 75159060-75159210 | SEC14L1 | 55.75 |
| chr5: 72860560-72860710 | AC099522.2 | 56.02 |
| chr3: 129539580-129539730 | TMCC1 | 59.03 |
| chr2: 127412720-127412870 | GYPC | 60.09 |
| chr8: 37986280-37986430 | STAR | 60.16 |
| chr10: 71087625-71087775 | HKDC1 | 60.3 |