SOM cluster: 649
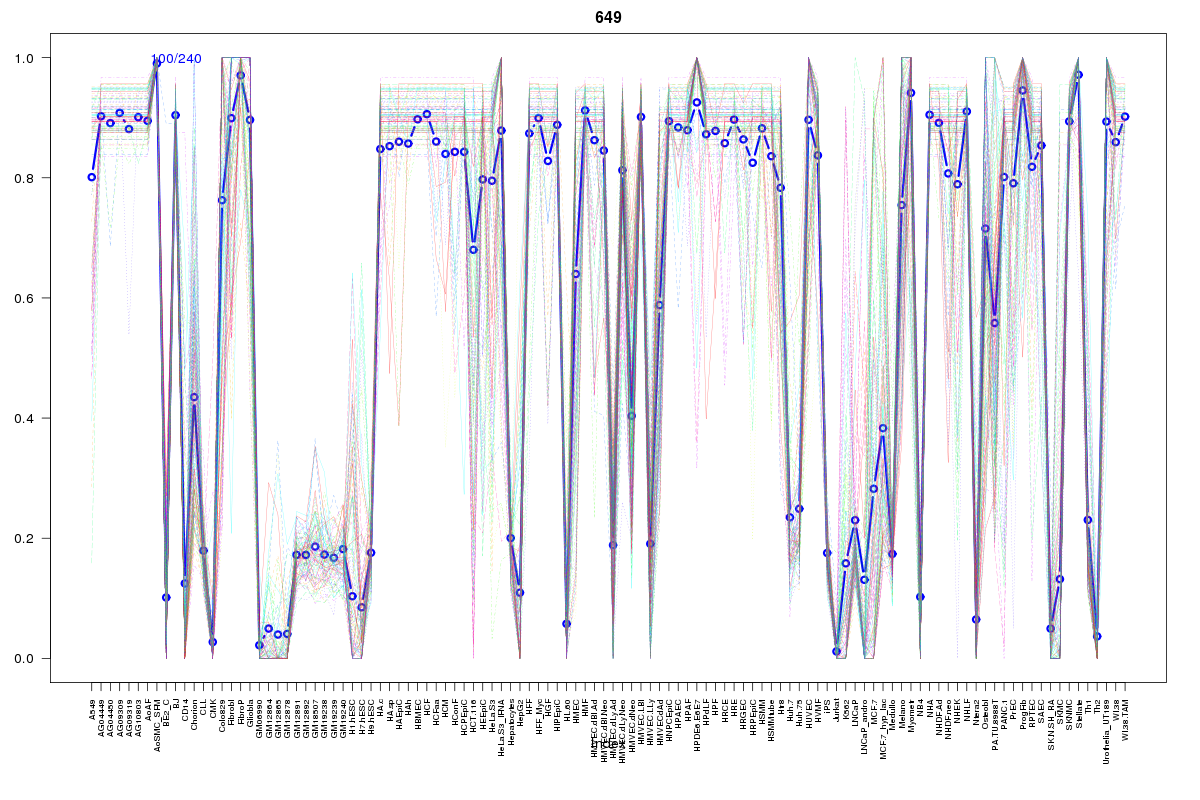
Cluster Hypersensitivity Profile

Genomic Location Trend
These plots show the distribution of the DHS sites surrounding the Transcript Start Site of the nearest gene.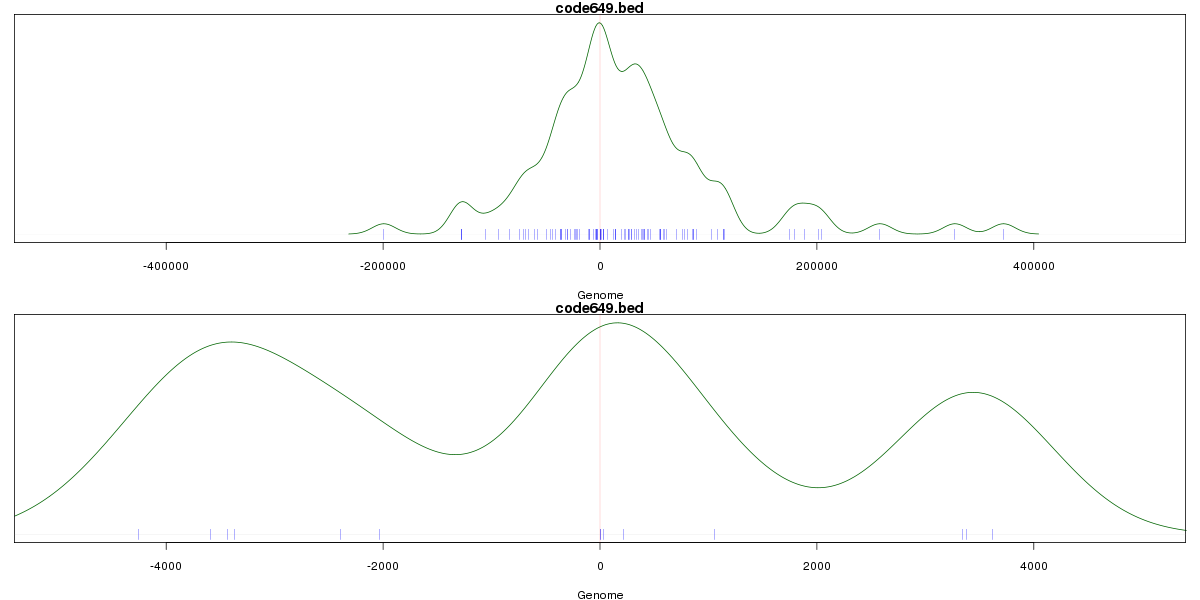
Stats
Number of sites: 240Promoter: 2%
CpG-Island: 0%
Conserved: 63%
Enriched Motifs & Matches
Match Detail: [Jaspar]
|
| ||
|---|---|---|
| Sites: 73/100 | e-val: 0 | ||
| Factor | e-val(match) | DB |
| AP1 | 0.0000002198 | JASPAR |
| NFE2L2 | 0.0000013083 | JASPAR |
| NFE2L1::MafG | 0.012242 | JASPAR |
| PPARG | 0.022444 | JASPAR |
| Pax2 | 0.040391 | JASPAR |
|
| ||
| Sites: 29/100 | e-val: 0.047 | ||
| Factor | e-val(match) | DB |
| TEAD1 | 0.0000000028078 | JASPAR |
| FEV | 0.000014087 | JASPAR |
| Stat3 | 0.00025344 | JASPAR |
| SPI1 | 0.00051136 | JASPAR |
| NF-kappaB | 0.0011999 | JASPAR |
|
| ||
| Sites: 19/100 | e-val: 1.6 | ||
| Factor | e-val(match) | DB |
| Foxd3 | 0.00016274 | JASPAR |
| MEF2A | 0.00051012 | JASPAR |
| Foxq1 | 0.0017531 | JASPAR |
| EWSR1-FLI1 | 0.003002 | JASPAR |
| NFATC2 | 0.010288 | JASPAR |
BED file downloads
Top 10 Example Regions
| Location | Gene Link | Dist. |
|---|---|---|
| chr10: 27481320-27481470 | MASTL | 39.25 |
| chr1: 203662360-203662510 | LAX1 | 45.04 |
| chr1: 203662360-203662510 | SNORA77 | 45.04 |
| chr1: 203662360-203662510 | ATP2B4 | 45.04 |
| chr6: 57132880-57133030 | RAB23 | 48.32 |
| chr19: 11196125-11196275 | SMARCA4 | 55.18 |
| chr19: 11196125-11196275 | LDLR | 55.18 |
| chr19: 11196125-11196275 | SPC24 | 55.18 |
| chr19: 11196125-11196275 | KANK2 | 55.18 |
| chr7: 55200540-55200690 | EGFR-AS1 | 55.24 |