SOM cluster: 645
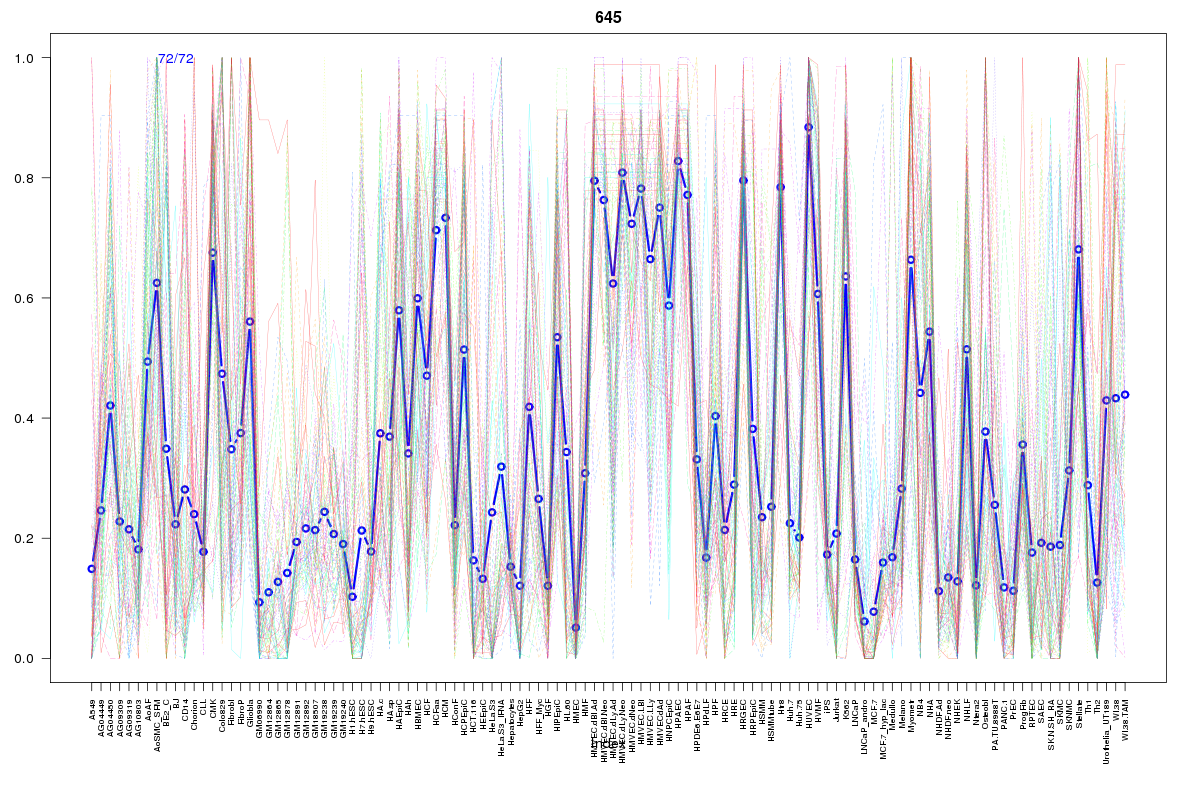
Cluster Hypersensitivity Profile

Genomic Location Trend
These plots show the distribution of the DHS sites surrounding the Transcript Start Site of the nearest gene.
Stats
Number of sites: 72Promoter: 0%
CpG-Island: 0%
Conserved: 39%
Enriched Motifs & Matches
Match Detail: [Jaspar]
|
| ||
|---|---|---|
| Sites: 41/72 | e-val: 0.0000000017 | ||
| Factor | e-val(match) | DB |
| FEV | 0.000000024559 | JASPAR |
| ELK4 | 0.00000011367 | JASPAR |
| Stat3 | 0.00000051671 | JASPAR |
| SPIB | 0.0000008605 | JASPAR |
| SPI1 | 0.0000019922 | JASPAR |