SOM cluster: 641
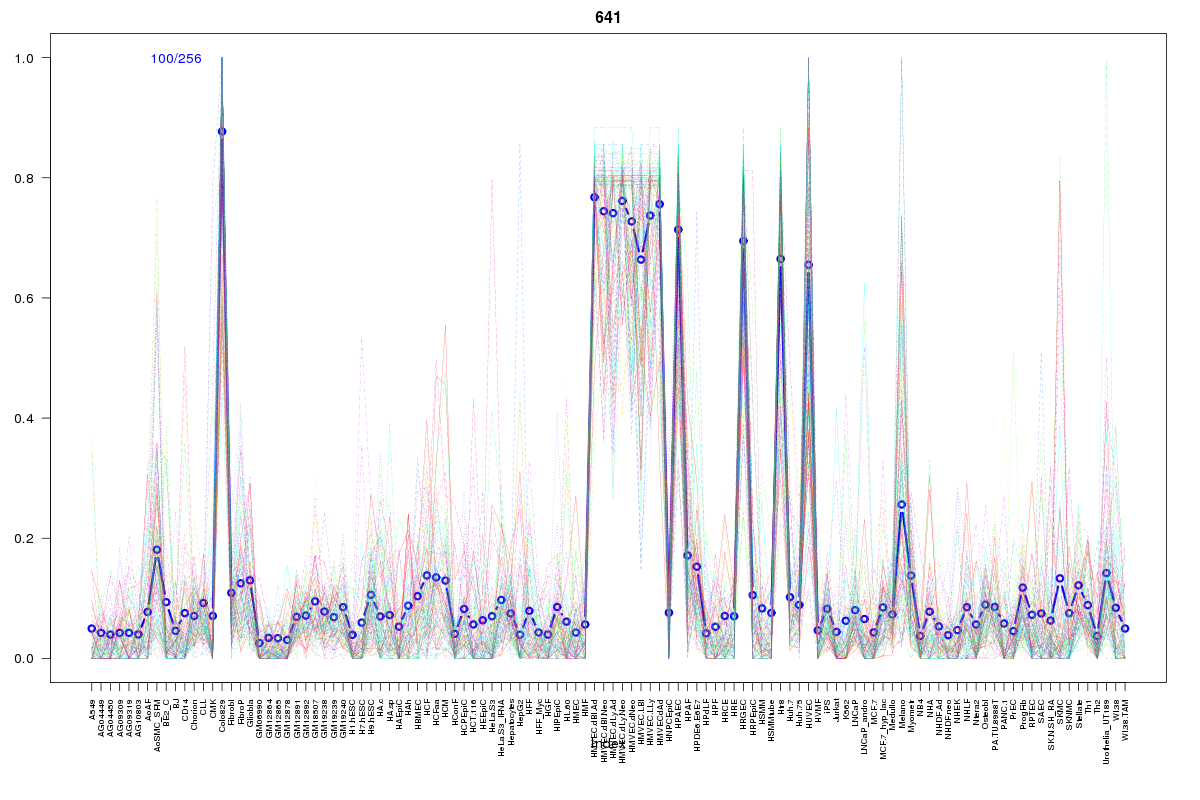
Cluster Hypersensitivity Profile

Genomic Location Trend
These plots show the distribution of the DHS sites surrounding the Transcript Start Site of the nearest gene.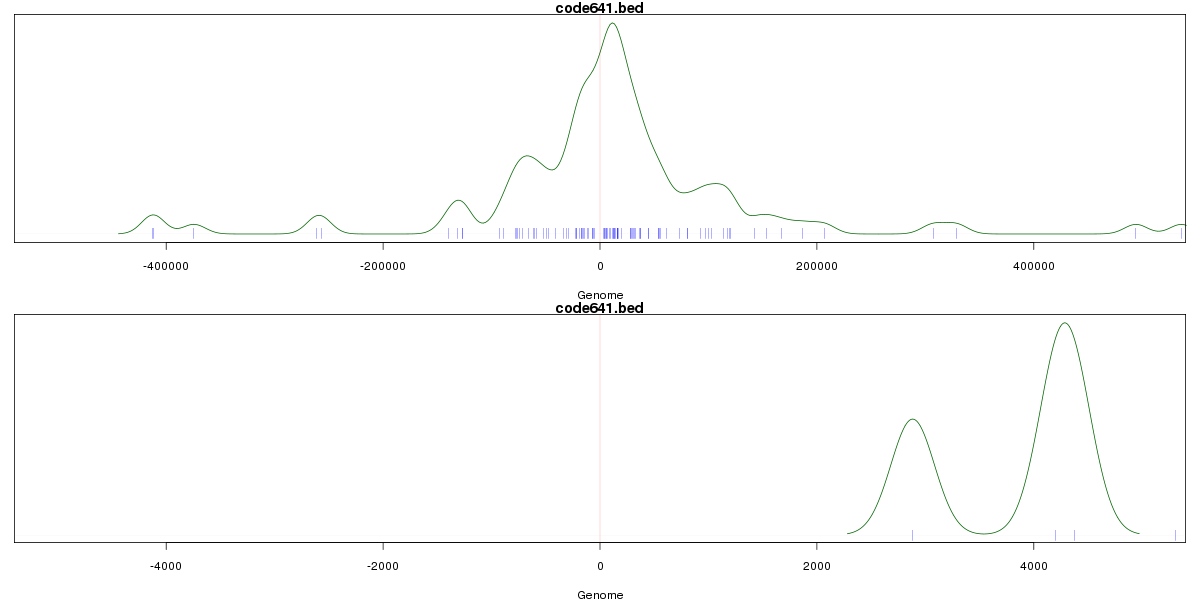
Stats
Number of sites: 256Promoter: 0%
CpG-Island: 0%
Conserved: 64%
Enriched Motifs & Matches
Match Detail: [Jaspar]
|
| ||
|---|---|---|
| Sites: 72/100 | e-val: 7.39886e-43 | ||
| Factor | e-val(match) | DB |
| FEV | 0.00000049694 | JASPAR |
| SPIB | 0.00031344 | JASPAR |
| Stat3 | 0.00066191 | JASPAR |
| ELK4 | 0.0012246 | JASPAR |
| SPI1 | 0.0015623 | JASPAR |
|
| ||
| Sites: 14/100 | e-val: 0.38 | ||
| Factor | e-val(match) | DB |
| Foxd3 | 0.0000000030111 | JASPAR |
| FOXI1 | 0.00000045339 | JASPAR |
| Foxq1 | 0.000017036 | JASPAR |
| FOXA1 | 0.00045834 | JASPAR |
| SRY | 0.0011978 | JASPAR |
BED file downloads
Top 10 Example Regions
| Location | Gene Link | Dist. |
|---|---|---|
| chr3: 37321460-37321610 | AC097359.2 | 31.8 |
| chr12: 75965100-75965250 | RP11-585P4.5 | 39.83 |
| chr1: 150665320-150665470 | GOLPH3L | 42.59 |
| chr5: 72803020-72803170 | RP11-79P5.3 | 43.37 |
| chr5: 72803020-72803170 | AC099522.2 | 43.37 |
| chr3: 184337320-184337470 | MAGEF1 | 52.18 |
| chr3: 184337320-184337470 | EPHB3 | 52.18 |
| chr4: 147328780-147328930 | SLC10A7 | 53.97 |
| chr7: 107335000-107335150 | BCAP29 | 54.29 |
| chr7: 107335000-107335150 | WBP1LP2 | 54.29 |