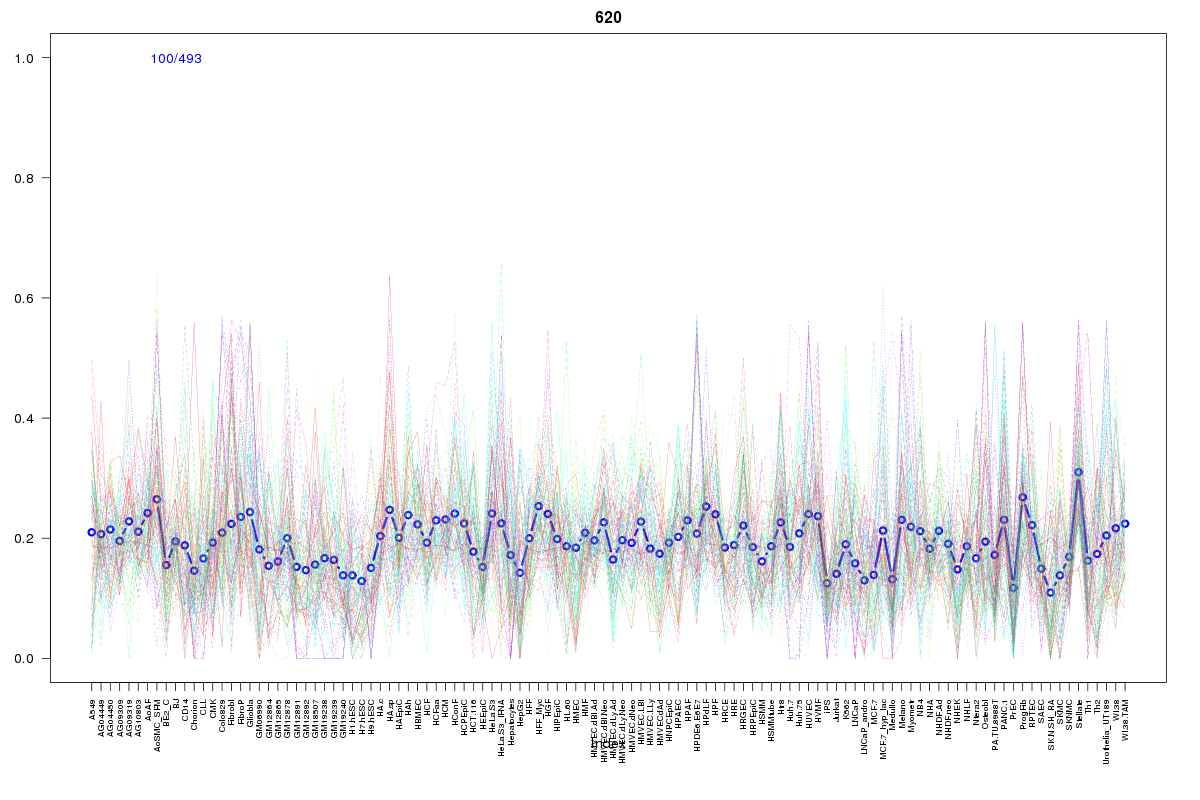
SOM cluster: 620
Cluster Hypersensitivity Profile

Genomic Location Trend
These plots show the distribution of the DHS sites surrounding the Transcript Start Site of the nearest gene.
Stats
Number of sites: 493Promoter: 45%
CpG-Island: 10%
Conserved: 34%
Enriched Motifs & Matches
Match Detail: [Jaspar]
|
| ||
|---|---|---|
| Sites: 15/100 | e-val: 0.013 | ||
| Factor | e-val(match) | DB |
| Foxd3 | 0.00048883 | JASPAR |
| znf143 | 0.0011766 | JASPAR |
| FOXA1 | 0.0036878 | JASPAR |
| Stat3 | 0.0060505 | JASPAR |
| NFATC2 | 0.0081593 | JASPAR |
BED file downloads
Top 10 Example Regions
| Location | Gene Link | Dist. |
|---|---|---|
| chr9: 110252780-110252930 | KLF4 | 36.14 |
| chr10: 30724160-30724310 | MAP3K8 | 52.19 |
| chr9: 133321225-133321375 | snoU13 | 52.95 |
| chr11: 118789860-118790010 | RN7SL529P | 57.58 |
| chr3: 173113125-173113275 | NLGN1 | 59.2 |
| chr1: 159893925-159894075 | SLAMF9 | 60.4 |
| chr2: 25193920-25194070 | ADCY3 | 60.58 |
| chr2: 111875940-111876090 | ACOXL | 63.7 |
| chr17: 7787305-7787455 | CHD3 | 64.92 |
| chr17: 38599180-38599330 | IGFBP4 | 65.86 |