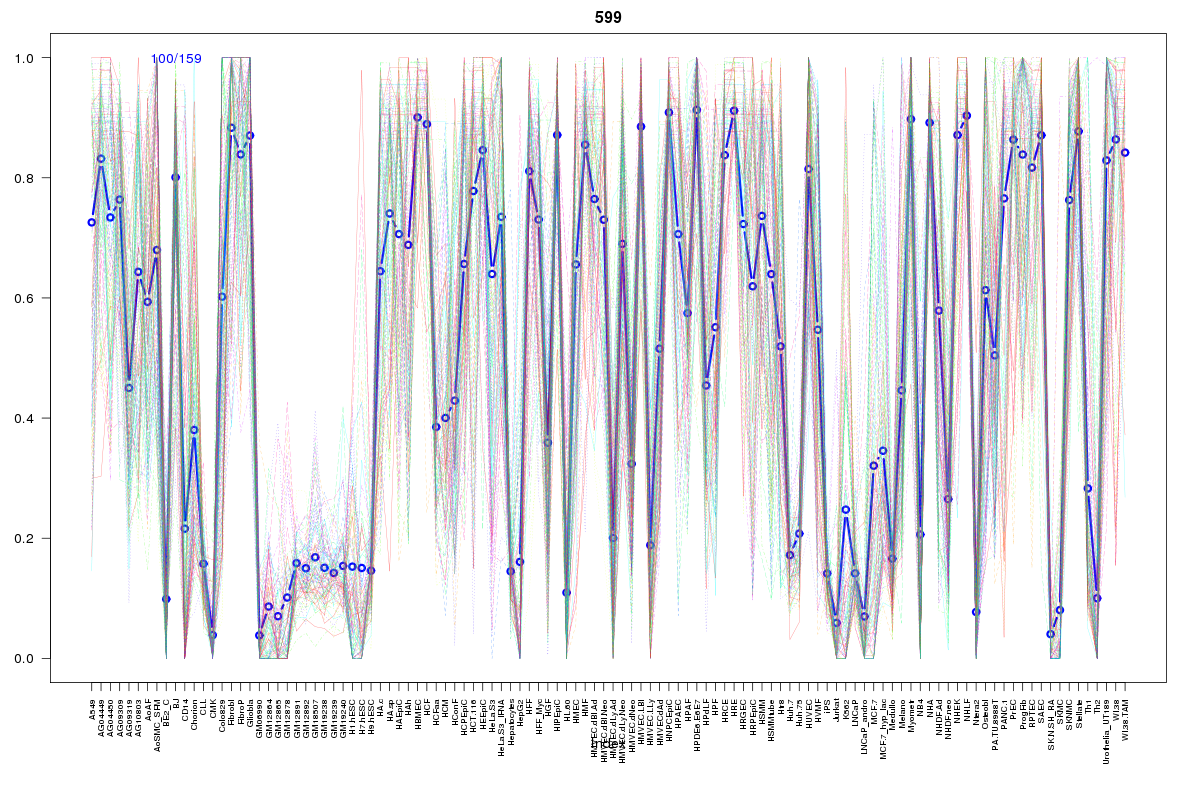
SOM cluster: 599
Cluster Hypersensitivity Profile

Genomic Location Trend
These plots show the distribution of the DHS sites surrounding the Transcript Start Site of the nearest gene.
Stats
Number of sites: 159Promoter: 2%
CpG-Island: 0%
Conserved: 47%
Enriched Motifs & Matches
Match Detail: [Jaspar]
|
| ||
|---|---|---|
| Sites: 73/100 | e-val: 0 | ||
| Factor | e-val(match) | DB |
| AP1 | 0.000000000018965 | JASPAR |
| NFE2L2 | 0.0000000052909 | JASPAR |
| PPARG | 0.0032339 | JASPAR |
| NFE2L1::MafG | 0.0051856 | JASPAR |
| Foxa2 | 0.013136 | JASPAR |
|
| ||
| Sites: 19/100 | e-val: 0.85 | ||
| Factor | e-val(match) | DB |
| AP1 | 0.00000081582 | JASPAR |
| PBX1 | 0.00017219 | JASPAR |
| NFE2L2 | 0.00051669 | JASPAR |
| HOXA5 | 0.00068882 | JASPAR |
| Pax5 | 0.0011775 | JASPAR |
|
| ||
| Sites: 15/100 | e-val: 0.9 | ||
| Factor | e-val(match) | DB |
| FOXA1 | 0.00050316 | JASPAR |
| SPIB | 0.00069521 | JASPAR |
| EWSR1-FLI1 | 0.0011487 | JASPAR |
| REL | 0.011944 | JASPAR |
| NR1H2::RXRA | 0.020564 | JASPAR |
BED file downloads
Top 10 Example Regions
| Location | Gene Link | Dist. |
|---|---|---|
| chr8: 54798540-54798690 | RP11-30L15.4 | 45.5 |
| chr8: 54798540-54798690 | RGS20 | 45.5 |
| chr5: 172205240-172205390 | DUSP1 | 45.55 |
| chr5: 172205240-172205390 | RP11-779O18.3 | 45.55 |
| chr22: 39970900-39971050 | RPS19BP1 | 49.45 |
| chr22: 39970900-39971050 | RP5-1104E15.6 | 49.45 |
| chr22: 39970900-39971050 | MGAT3 | 49.45 |
| chr11: 14358800-14358950 | RRAS2 | 52.67 |
| chr1: 65889760-65889910 | LEPROT | 58.44 |
| chr3: 47952380-47952530 | MAP4 | 58.67 |