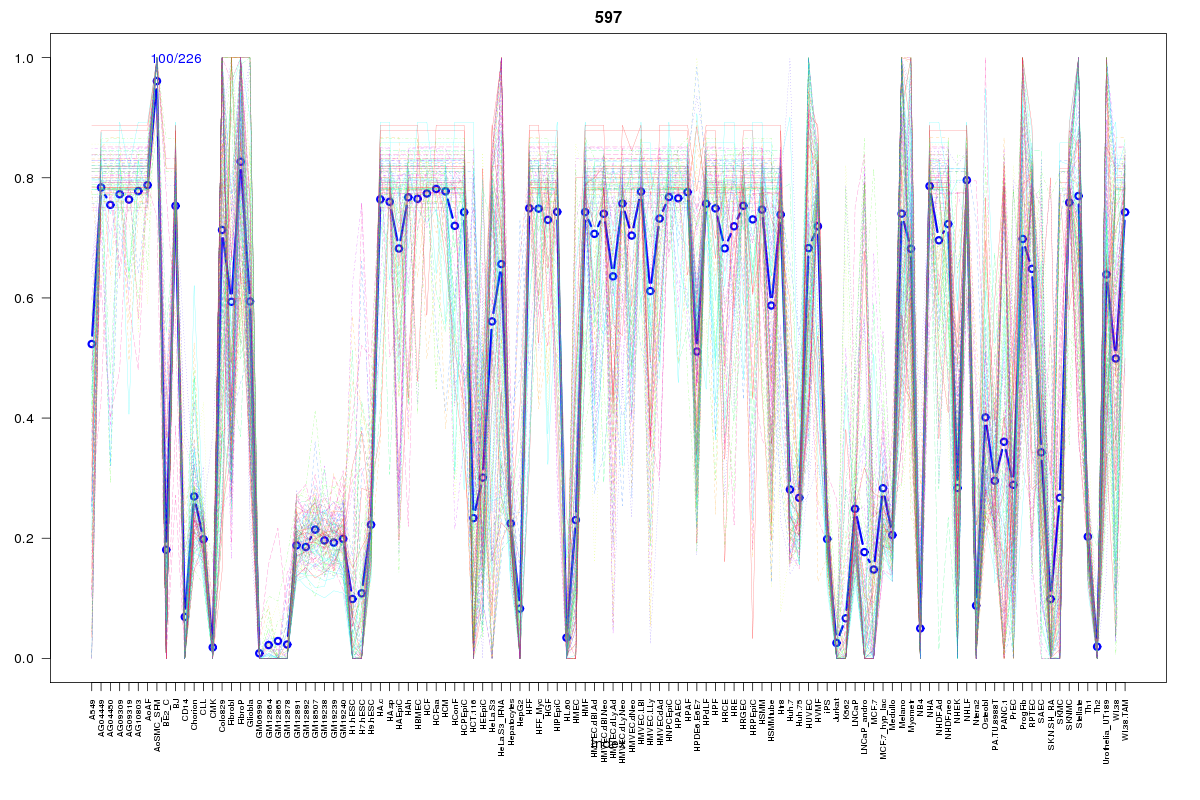
SOM cluster: 597
Cluster Hypersensitivity Profile

Genomic Location Trend
These plots show the distribution of the DHS sites surrounding the Transcript Start Site of the nearest gene.
Stats
Number of sites: 226Promoter: 5%
CpG-Island: 0%
Conserved: 72%
Enriched Motifs & Matches
Match Detail: [Jaspar]
|
| ||
|---|---|---|
| Sites: 40/100 | e-val: 0.0000000016 | ||
| Factor | e-val(match) | DB |
| TEAD1 | 0.000001435 | JASPAR |
| RELA | 0.0000046638 | JASPAR |
| NF-kappaB | 0.0000080884 | JASPAR |
| REL | 0.00013077 | JASPAR |
| Stat3 | 0.00057624 | JASPAR |
BED file downloads
Top 10 Example Regions
| Location | Gene Link | Dist. |
|---|---|---|
| chr1: 92295880-92296030 | TGFBR3 | 22.87 |
| chr1: 78471520-78471670 | FUBP1 | 34.8 |
| chr1: 78471520-78471670 | NEXN | 34.8 |
| chr1: 78471520-78471670 | DNAJB4 | 34.8 |
| chr1: 183149520-183149670 | LAMC1 | 41.91 |
| chr1: 183149520-183149670 | RP11-548N1.1 | 41.91 |
| chr1: 41568040-41568190 | CTPS1 | 44.98 |
| chr1: 41568040-41568190 | SCMH1 | 44.98 |
| chr1: 41568040-41568190 | SLFNL1 | 44.98 |
| chr1: 67029240-67029390 | SGIP1 | 45.48 |