SOM cluster: 593
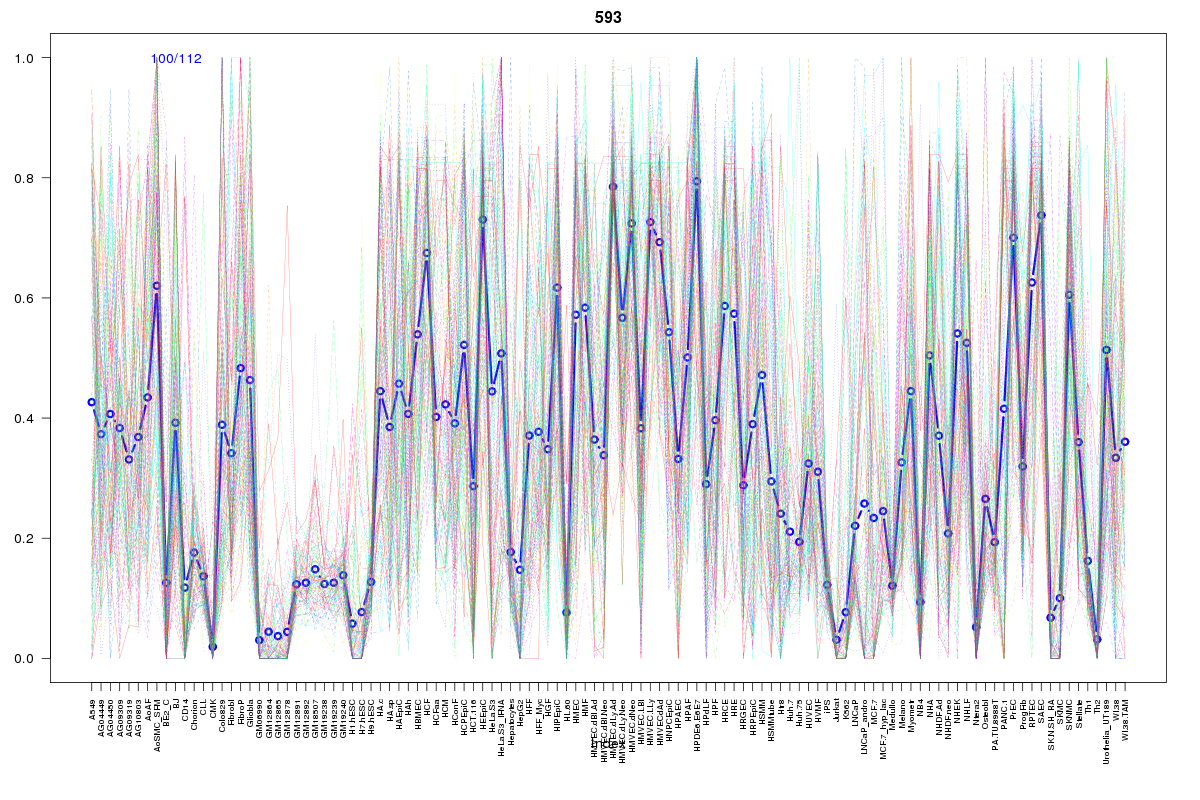
Cluster Hypersensitivity Profile

Genomic Location Trend
These plots show the distribution of the DHS sites surrounding the Transcript Start Site of the nearest gene.
Stats
Number of sites: 112Promoter: 4%
CpG-Island: 0%
Conserved: 45%
Enriched Motifs & Matches
Match Detail: [Jaspar]
|
| ||
|---|---|---|
| Sites: 32/100 | e-val: 0.0000031 | ||
| Factor | e-val(match) | DB |
| AP1 | 0.0000000005365 | JASPAR |
| NFE2L2 | 0.00000000088748 | JASPAR |
| NFE2L1::MafG | 0.00056519 | JASPAR |
| Pax2 | 0.0031461 | JASPAR |
| PPARG | 0.0076666 | JASPAR |
BED file downloads
Top 10 Example Regions
| Location | Gene Link | Dist. |
|---|---|---|
| chr1: 117363120-117363270 | CD2 | 35.32 |
| chr1: 94058660-94058810 | FNBP1L | 40.75 |
| chr1: 94058660-94058810 | BCAR3 | 40.75 |
| chr2: 51180280-51180430 | NRXN1 | 43.35 |
| chr3: 30667460-30667610 | TGFBR2 | 57.28 |
| chr10: 88842040-88842190 | FAM35A | 63.97 |
| chr10: 88842040-88842190 | RP11-96C23.9 | 63.97 |
| chr10: 101441440-101441590 | CUTC | 67.05 |
| chr10: 101441440-101441590 | COX15 | 67.05 |
| chr21: 36143940-36144090 | CLIC6 | 69.63 |