SOM cluster: 560
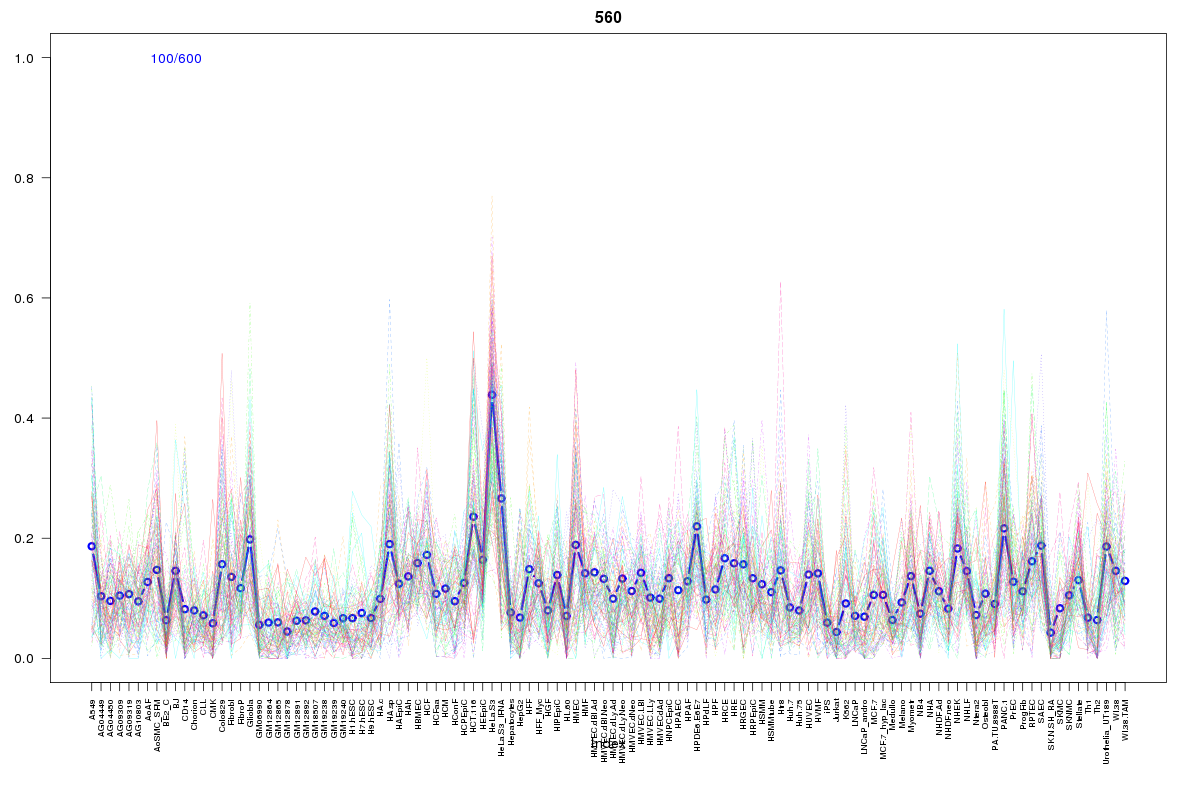
Cluster Hypersensitivity Profile

Genomic Location Trend
These plots show the distribution of the DHS sites surrounding the Transcript Start Site of the nearest gene.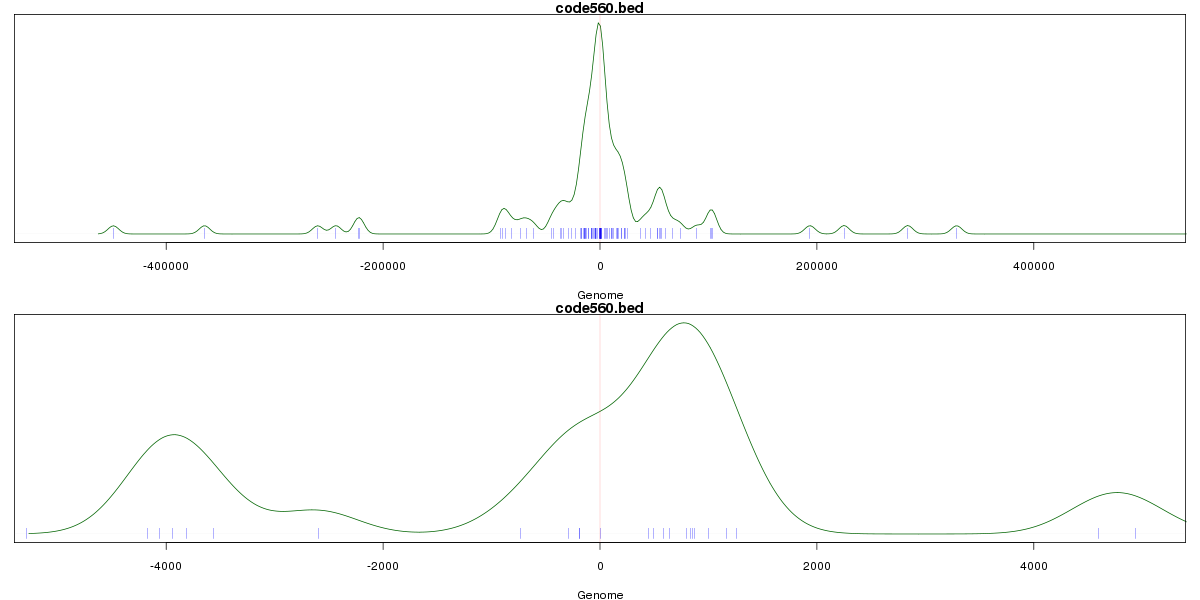
Stats
Number of sites: 600Promoter: 7%
CpG-Island: 0%
Conserved: 20%
Enriched Motifs & Matches
Match Detail: [Jaspar]
|
| ||
|---|---|---|
| Sites: 19/100 | e-val: 0.35 | ||
| Factor | e-val(match) | DB |
| MEF2A | 0.000099826 | JASPAR |
| Nkx2-5 | 0.00010209 | JASPAR |
| Sox5 | 0.00075566 | JASPAR |
| Pax4 | 0.0032575 | JASPAR |
| ARID3A | 0.0035609 | JASPAR |
BED file downloads
Top 10 Example Regions
| Location | Gene Link | Dist. |
|---|---|---|
| chrX: 53310485-53310635 | IQSEC2 | 36.17 |
| chrX: 53310485-53310635 | KDM5C | 36.17 |
| chr1: 95193805-95193955 | SLC44A3 | 37.01 |
| chr1: 95193805-95193955 | LINC01057 | 37.01 |
| chr1: 171786680-171786830 | METTL13 | 43.72 |
| chr11: 33744480-33744630 | CD59 | 44.33 |
| chr11: 33744480-33744630 | FBXO3 | 44.33 |
| chr11: 33744480-33744630 | C11orf91 | 44.33 |
| chr5: 106954060-106954210 | EFNA5 | 46.56 |
| chr1: 241682060-241682210 | OPN3 | 50.41 |