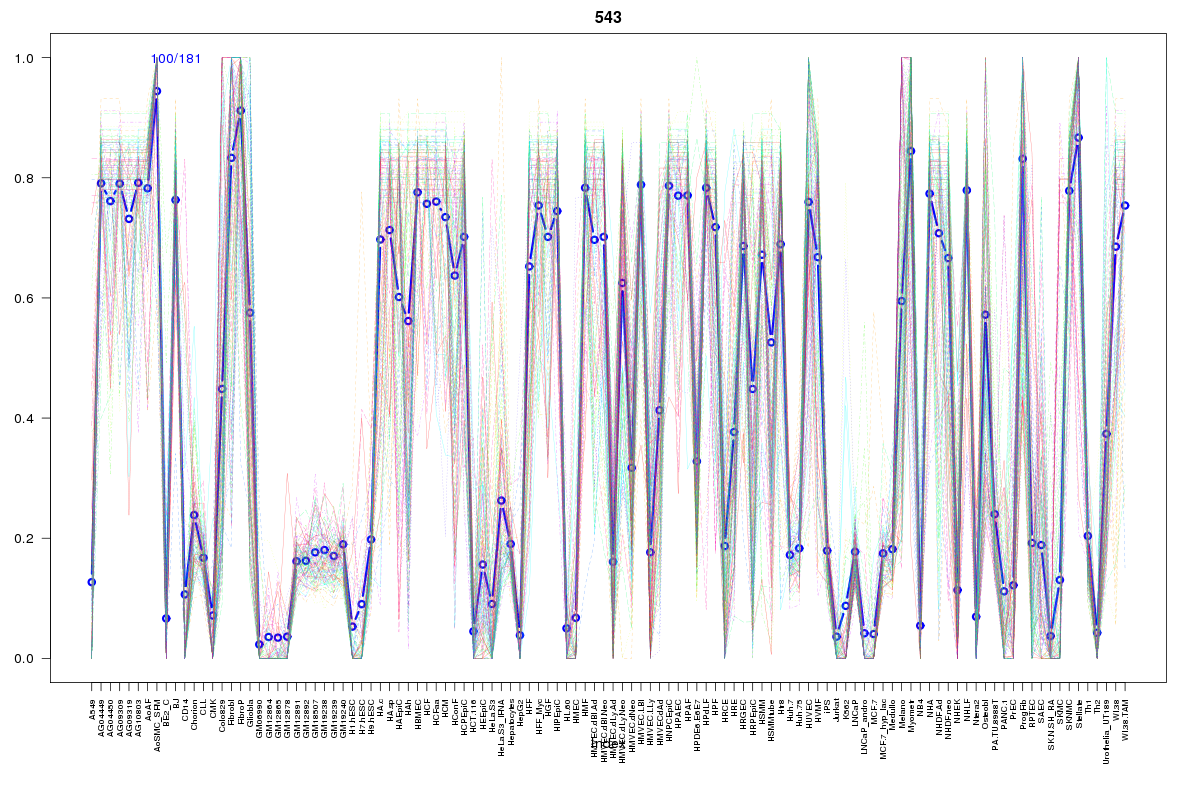
SOM cluster: 543
Cluster Hypersensitivity Profile

Genomic Location Trend
These plots show the distribution of the DHS sites surrounding the Transcript Start Site of the nearest gene.
Stats
Number of sites: 181Promoter: 1%
CpG-Island: 0%
Conserved: 65%
Enriched Motifs & Matches
Match Detail: [Jaspar]
|
| ||
|---|---|---|
| Sites: 35/100 | e-val: 0.000012 | ||
| Factor | e-val(match) | DB |
| Foxd3 | 0.00043622 | JASPAR |
| Foxq1 | 0.00080584 | JASPAR |
| Pax4 | 0.0010382 | JASPAR |
| IRF1 | 0.0066245 | JASPAR |
| SRY | 0.014943 | JASPAR |
BED file downloads
Top 10 Example Regions
| Location | Gene Link | Dist. |
|---|---|---|
| chr1: 94091220-94091370 | RP5-1033H22.2 | 31.79 |
| chr8: 121869840-121869990 | SNTB1 | 33.7 |
| chr8: 17468425-17468575 | PDGFRL | 38.22 |
| chr8: 17468425-17468575 | RP11-326L2.1 | 38.22 |
| chr3: 158189500-158189650 | RSRC1 | 43.86 |
| chr12: 120637800-120637950 | GCN1L1 | 45.23 |
| chr12: 120637800-120637950 | PXN-AS1 | 45.23 |
| chr7: 65210760-65210910 | CCT6P1 | 53.62 |
| chr5: 148591820-148591970 | ABLIM3 | 60.07 |
| chr4: 124282720-124282870 | SPATA5 | 63.35 |