SOM cluster: 536
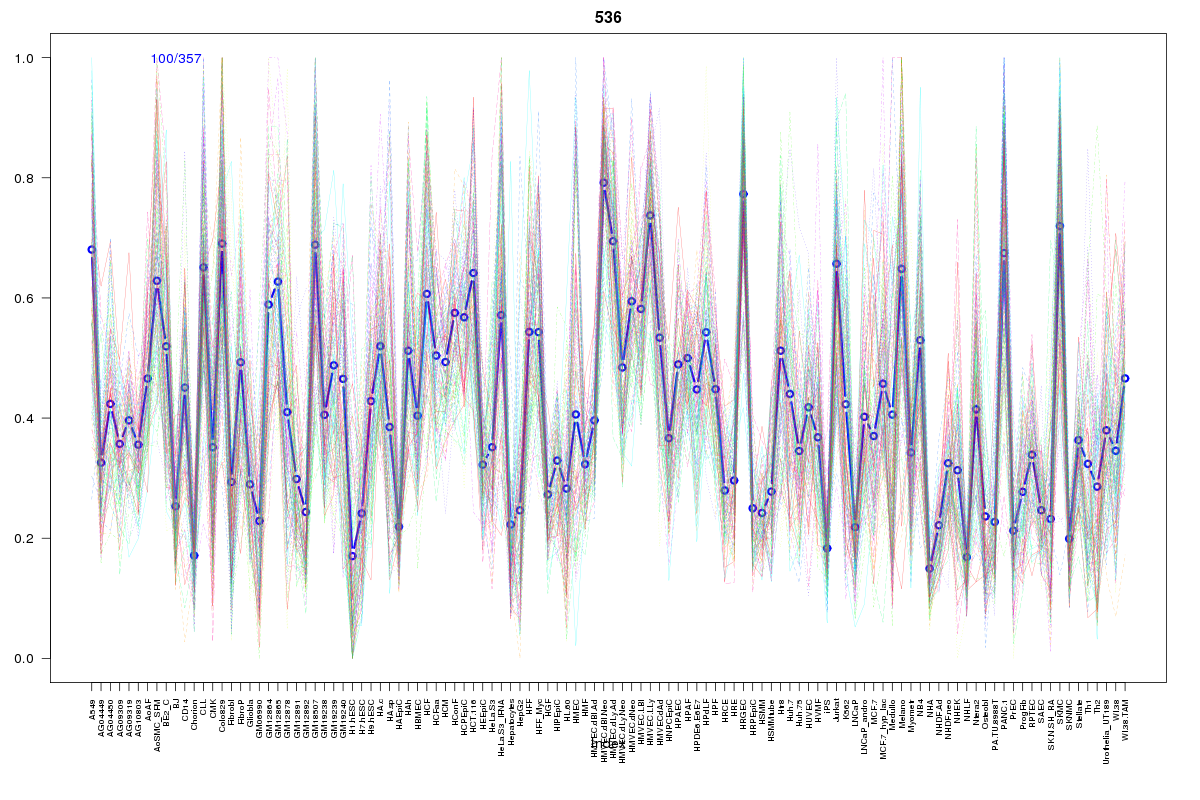
Cluster Hypersensitivity Profile

Genomic Location Trend
These plots show the distribution of the DHS sites surrounding the Transcript Start Site of the nearest gene.
Stats
Number of sites: 357Promoter: 5%
CpG-Island: 0%
Conserved: 92%
Enriched Motifs & Matches
Match Detail: [Jaspar]
|
| ||
|---|---|---|
| Sites: 94/100 | e-val: 0 | ||
| Factor | e-val(match) | DB |
| CTCF | 0.000000000000077494 | JASPAR |
| Zfp423 | 0.0011861 | JASPAR |
| RXR::RAR_DR5 | 0.0016198 | JASPAR |
| T | 0.002437 | JASPAR |
| INSM1 | 0.010223 | JASPAR |
|
| ||
| Sites: 89/100 | e-val: 6.1e-21 | ||
| Factor | e-val(match) | DB |
| Foxd3 | 0.0039062 | JASPAR |
| HNF1A | 0.0077128 | JASPAR |
| Foxa2 | 0.0093187 | JASPAR |
| MEF2A | 0.0094787 | JASPAR |
| Foxq1 | 0.011438 | JASPAR |
BED file downloads
Top 10 Example Regions
| Location | Gene Link | Dist. |
|---|---|---|
| chr12: 9786920-9787070 | KLRB1 | 42.71 |
| chr12: 9786920-9787070 | RP11-705C15.3 | 42.71 |
| chr1: 70598740-70598890 | SRSF11 | 45.42 |
| chr1: 70598740-70598890 | LRRC7 | 45.42 |
| chr2: 54931960-54932110 | SPTBN1 | 48.95 |
| chr15: 101829260-101829410 | SNRPA1 | 51.62 |
| chr1: 92392920-92393070 | BRDT | 53.21 |
| chr7: 141485840-141485990 | KIAA1147 | 61.01 |
| chr7: 141485840-141485990 | TAS2R3 | 61.01 |
| chr7: 141485840-141485990 | MYL6P4 | 61.01 |