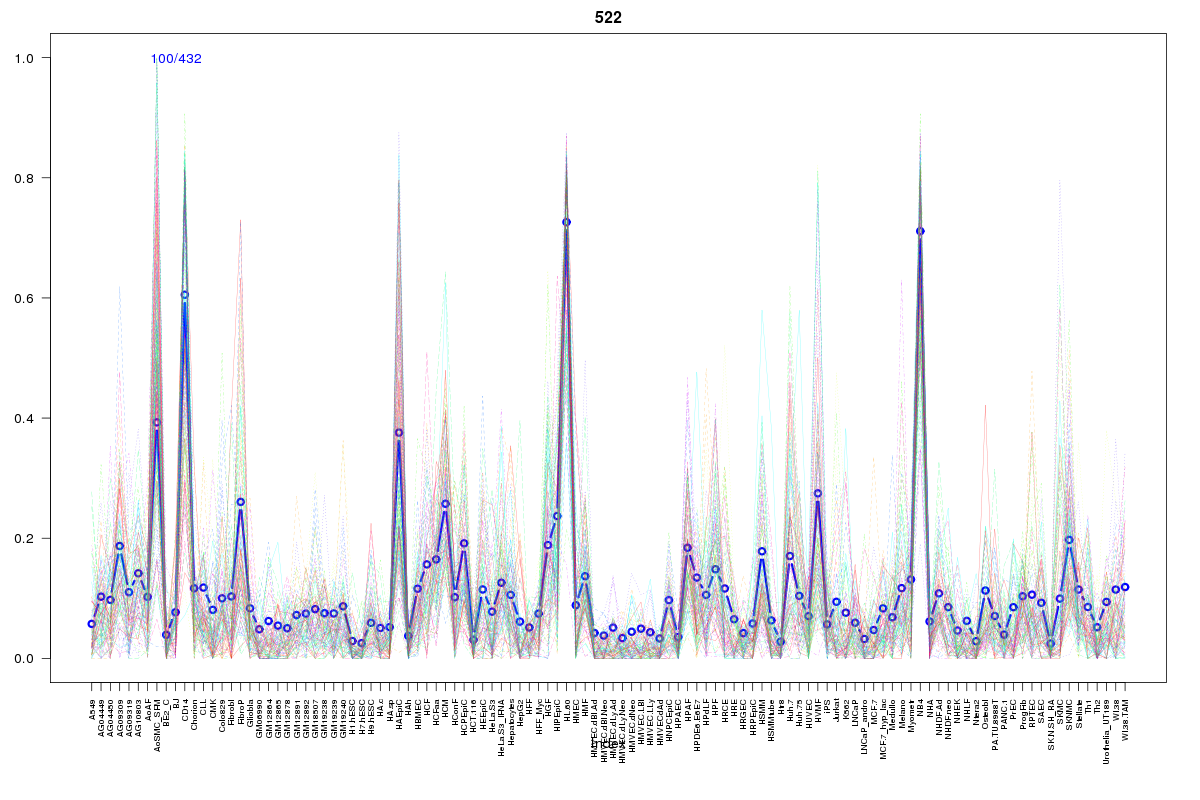
SOM cluster: 522
Cluster Hypersensitivity Profile

Genomic Location Trend
These plots show the distribution of the DHS sites surrounding the Transcript Start Site of the nearest gene.
Stats
Number of sites: 432Promoter: 2%
CpG-Island: 0%
Conserved: 20%
Enriched Motifs & Matches
Match Detail: [Jaspar]
|
| ||
|---|---|---|
| Sites: 37/100 | e-val: 0.0046 | ||
| Factor | e-val(match) | DB |
| CEBPA | 0.00000024565 | JASPAR |
| Pou5f1 | 0.0000064229 | JASPAR |
| Sox2 | 0.000024691 | JASPAR |
| NFIL3 | 0.0001421 | JASPAR |
| HLF | 0.00029297 | JASPAR |
BED file downloads
Top 10 Example Regions
| Location | Gene Link | Dist. |
|---|---|---|
| chr1: 198955280-198955430 | RP11-16L9.2 | 23.24 |
| chr1: 150294880-150295030 | C1orf51 | 26.81 |
| chr2: 153587220-153587370 | FMNL2 | 51.5 |
| chr5: 179207480-179207630 | C5orf45 | 55.86 |
| chr5: 179207480-179207630 | TBC1D9B | 55.86 |
| chr20: 47339080-47339230 | PREX1 | 56.57 |
| chr2: 36926260-36926410 | VIT | 62.62 |
| chr4: 154577300-154577450 | TLR2 | 65.97 |
| chr1: 203155860-203156010 | CHI3L1 | 66.35 |
| chr9: 3736420-3736570 | RP11-509J21.1 | 68.8 |