SOM cluster: 504
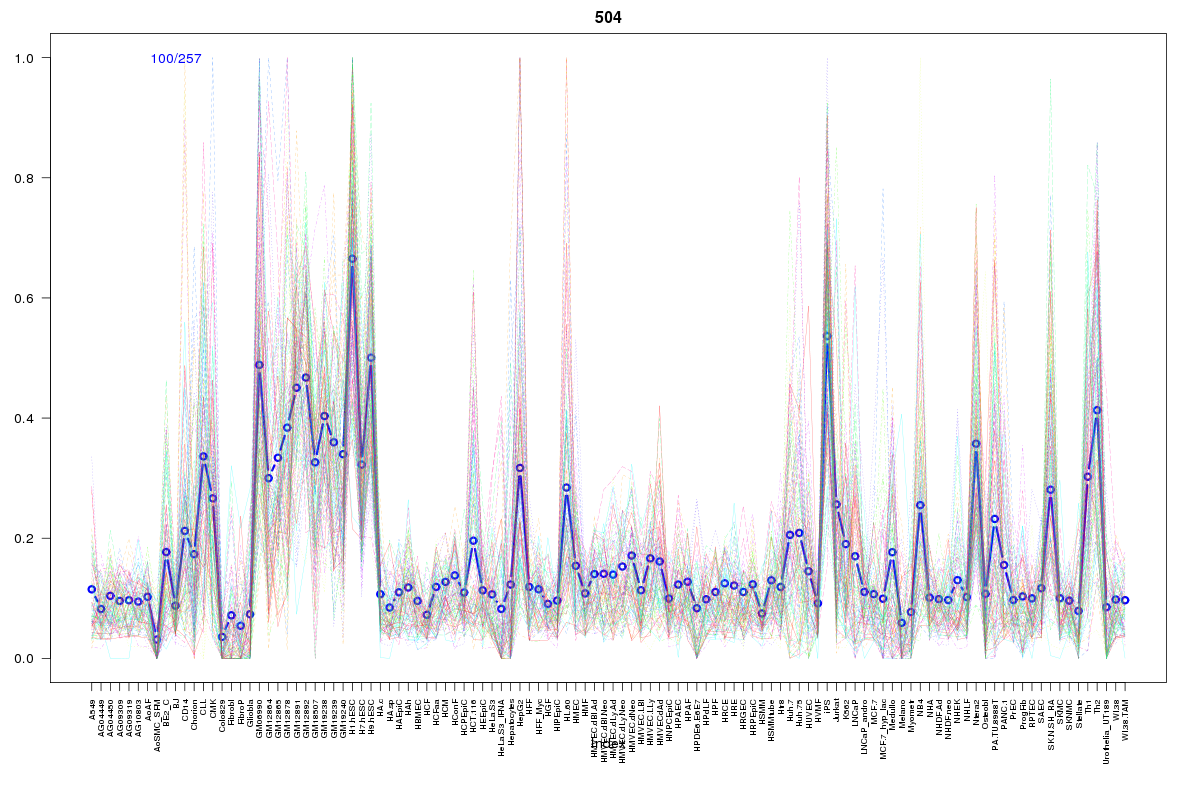
Cluster Hypersensitivity Profile

Genomic Location Trend
These plots show the distribution of the DHS sites surrounding the Transcript Start Site of the nearest gene.
Stats
Number of sites: 257Promoter: 23%
CpG-Island: 58%
Conserved: 44%
Enriched Motifs & Matches
Match Detail: [Jaspar]
|
| ||
|---|---|---|
| Sites: 94/100 | e-val: 0 | ||
| Factor | e-val(match) | DB |
| SP1 | 0.000000080118 | JASPAR |
| TFAP2A | 0.000063107 | JASPAR |
| RREB1 | 0.00061831 | JASPAR |
| Klf4 | 0.0019013 | JASPAR |
| Pax4 | 0.0021696 | JASPAR |
|
| ||
| Sites: 56/100 | e-val: 0.000000000054 | ||
| Factor | e-val(match) | DB |
| TFAP2A | 0.000018937 | JASPAR |
| SP1 | 0.00097482 | JASPAR |
| Zfx | 0.0083307 | JASPAR |
| PPARG | 0.047397 | JASPAR |
| PLAG1 | 0.050603 | JASPAR |
|
| ||
| Sites: 54/100 | e-val: 0.000062 | ||
| Factor | e-val(match) | DB |
| SP1 | 0.0000024611 | JASPAR |
| EWSR1-FLI1 | 0.0000048985 | JASPAR |
| Pax4 | 0.00039764 | JASPAR |
| Pax5 | 0.0082453 | JASPAR |
| MZF1_1-4 | 0.013002 | JASPAR |
BED file downloads
Top 10 Example Regions
| Location | Gene Link | Dist. |
|---|---|---|
| chr18: 21199020-21199170 | ANKRD29 | 34.06 |
| chr9: 35828765-35828915 | GBA2 | 41.8 |
| chr9: 35828765-35828915 | FAM221B | 41.8 |
| chr2: 64836225-64836375 | AFTPH | 47.98 |
| chr19: 10680380-10680530 | ILF3 | 54.3 |
| chr19: 10680380-10680530 | SLC44A2 | 54.3 |
| chr19: 10680380-10680530 | KEAP1 | 54.3 |
| chr19: 10680380-10680530 | ATG4D | 54.3 |
| chr19: 10680380-10680530 | KRI1 | 54.3 |
| chr19: 10680380-10680530 | S1PR5 | 54.3 |