SOM cluster: 500
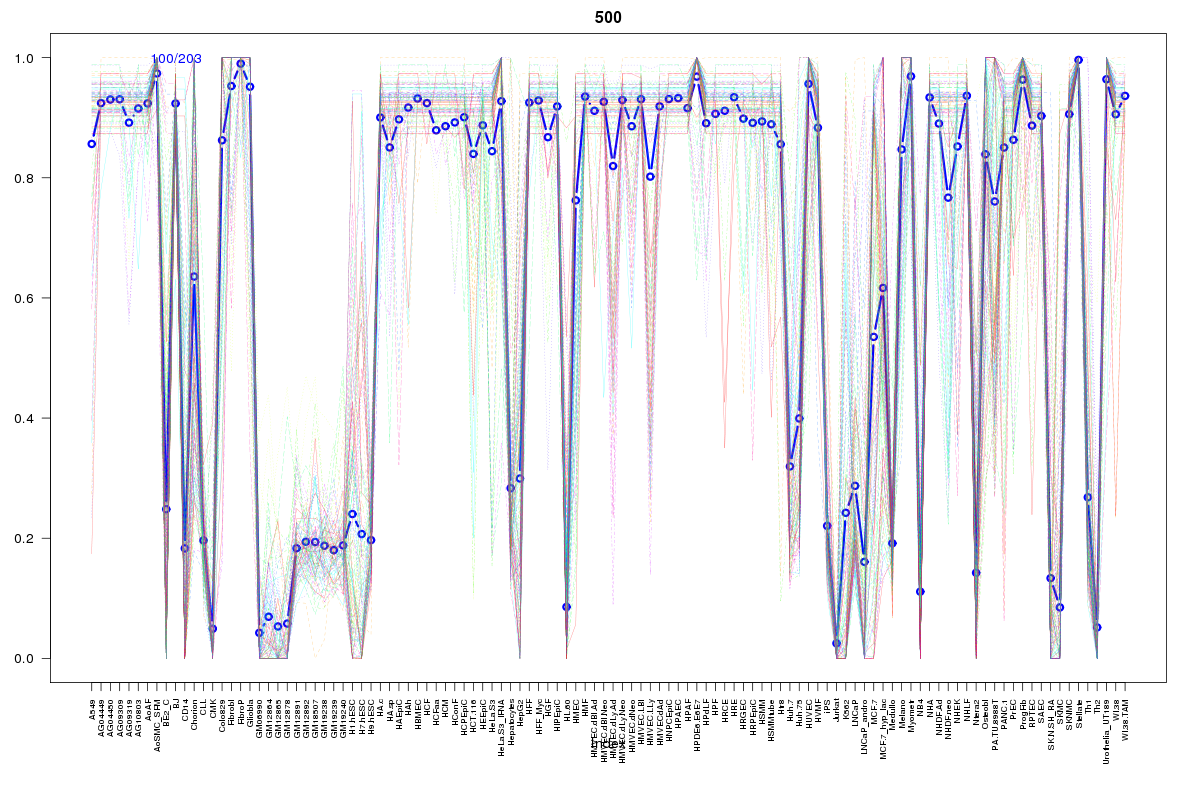
Cluster Hypersensitivity Profile

Genomic Location Trend
These plots show the distribution of the DHS sites surrounding the Transcript Start Site of the nearest gene.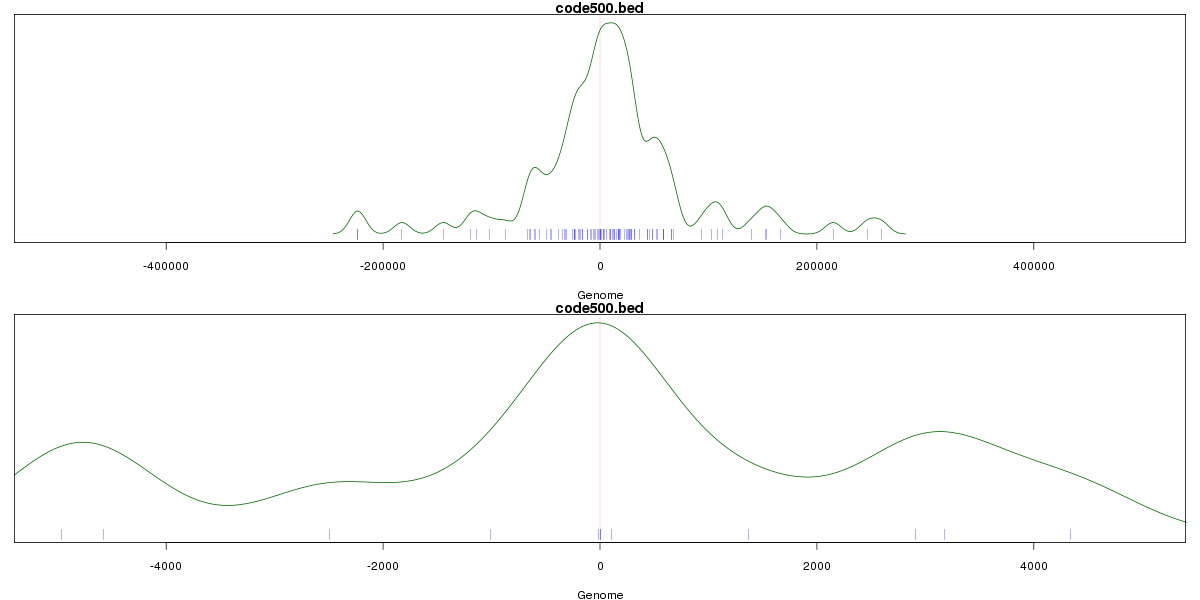
Stats
Number of sites: 203Promoter: 4%
CpG-Island: 1%
Conserved: 67%
Enriched Motifs & Matches
Match Detail: [Jaspar]
|
| ||
|---|---|---|
| Sites: 83/100 | e-val: 0 | ||
| Factor | e-val(match) | DB |
| NFE2L2 | 0.000000002593 | JASPAR |
| AP1 | 0.0000000032907 | JASPAR |
| PPARG | 0.0017638 | JASPAR |
| Pax2 | 0.0044479 | JASPAR |
| NR4A2 | 0.0045774 | JASPAR |
BED file downloads
Top 10 Example Regions
| Location | Gene Link | Dist. |
|---|---|---|
| chr11: 16813280-16813430 | C11orf58 | 36.83 |
| chr11: 16813280-16813430 | PLEKHA7 | 36.83 |
| chr3: 44927180-44927330 | EXOSC7 | 49.64 |
| chr3: 44927180-44927330 | KIF15 | 49.64 |
| chr3: 44927180-44927330 | TGM4 | 49.64 |
| chr9: 133838080-133838230 | ABL1 | 51.68 |
| chr9: 133838080-133838230 | FIBCD1 | 51.68 |
| chr1: 210013380-210013530 | TRAF3IP3 | 54.18 |
| chr10: 100220680-100220830 | PYROXD2 | 55.46 |
| chr5: 131601520-131601670 | PDLIM4 | 59.5 |