SOM cluster: 5
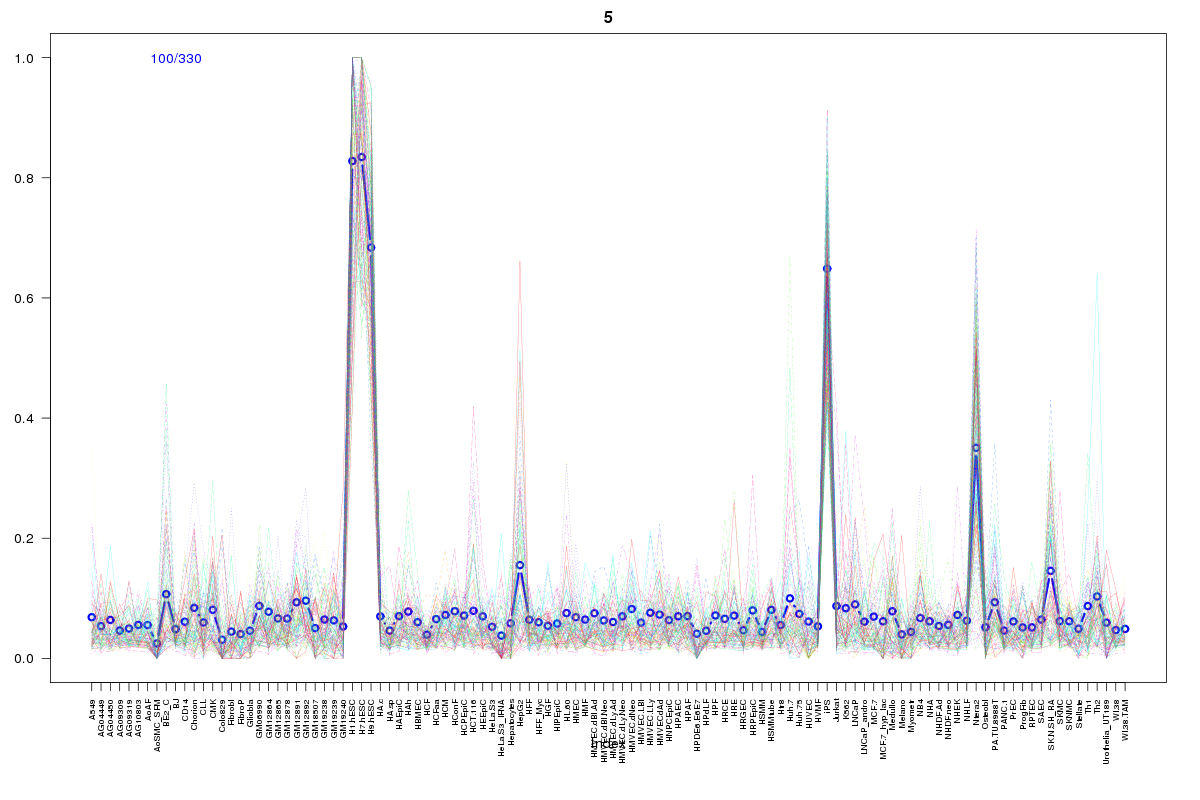
Cluster Hypersensitivity Profile

Genomic Location Trend
These plots show the distribution of the DHS sites surrounding the Transcript Start Site of the nearest gene.
Stats
Number of sites: 330Promoter: 10%
CpG-Island: 18%
Conserved: 42%
Enriched Motifs & Matches
Match Detail: [Jaspar]
|
| ||
|---|---|---|
| Sites: 73/100 | e-val: 0 | ||
| Factor | e-val(match) | DB |
| SP1 | 0.000000000036271 | JASPAR |
| Pax4 | 0.0000063078 | JASPAR |
| Klf4 | 0.000011754 | JASPAR |
| RREB1 | 0.00015126 | JASPAR |
| Egr1 | 0.00032129 | JASPAR |
BED file downloads
Top 10 Example Regions
| Location | Gene Link | Dist. |
|---|---|---|
| chr10: 22623380-22623530 | BMI1 | 25.07 |
| chr10: 22623380-22623530 | COMMD3 | 25.07 |
| chr8: 141450760-141450910 | TRAPPC9 | 47.01 |
| chr8: 141450760-141450910 | CASC7 | 47.01 |
| chr22: 36855540-36855690 | RP5-1119A7.14 | 49.44 |
| chr5: 159693880-159694030 | CCNJL | 54.3 |
| chr19: 11536680-11536830 | RGL3 | 54.31 |
| chr19: 11536680-11536830 | CCDC159 | 54.31 |
| chr1: 182669200-182669350 | RGS8 | 54.57 |
| chr9: 133892560-133892710 | AIF1L | 65.64 |