SOM cluster: 499
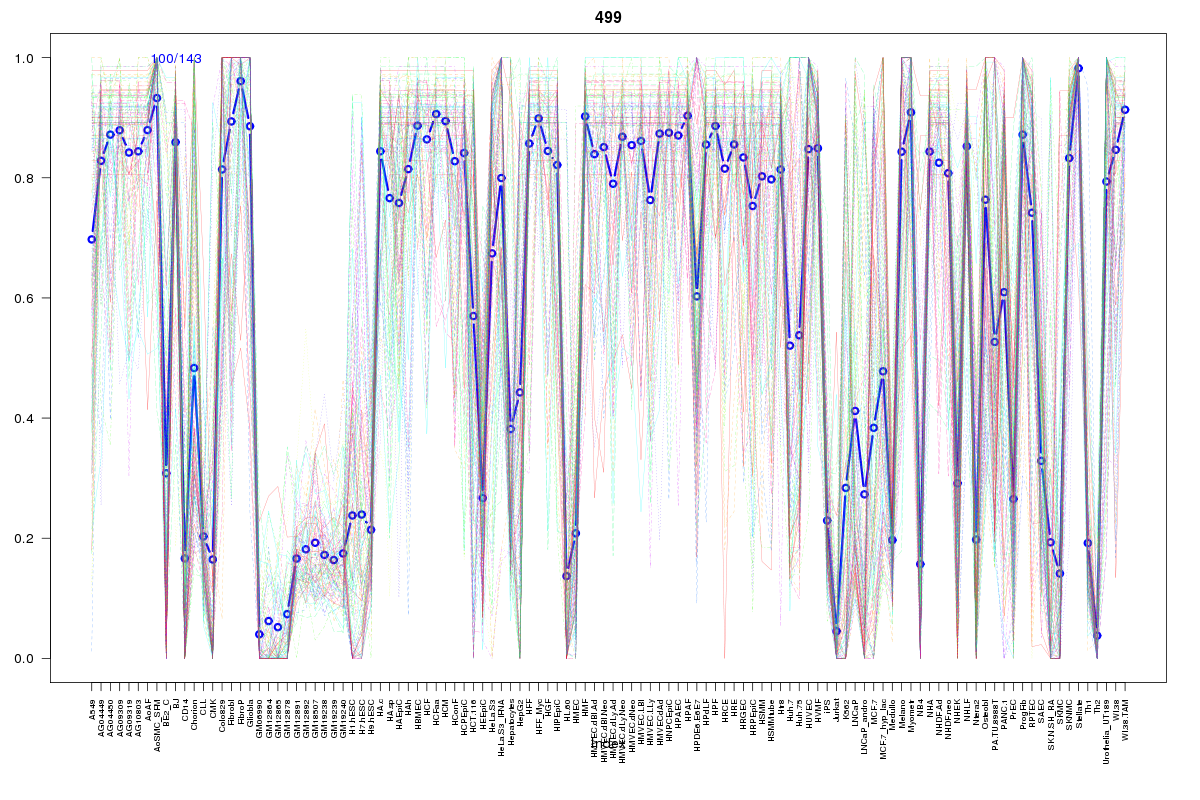
Cluster Hypersensitivity Profile

Genomic Location Trend
These plots show the distribution of the DHS sites surrounding the Transcript Start Site of the nearest gene.
Stats
Number of sites: 143Promoter: 6%
CpG-Island: 2%
Conserved: 65%
Enriched Motifs & Matches
Match Detail: [Jaspar]
|
| ||
|---|---|---|
| Sites: 55/100 | e-val: 1.1e-29 | ||
| Factor | e-val(match) | DB |
| AP1 | 0.0000000004502 | JASPAR |
| NFE2L2 | 0.0000000007076 | JASPAR |
| NFE2L1::MafG | 0.00019975 | JASPAR |
| Pax2 | 0.0063377 | JASPAR |
| PBX1 | 0.0084471 | JASPAR |
|
| ||
| Sites: 42/100 | e-val: 0.000012 | ||
| Factor | e-val(match) | DB |
| FEV | 0.00000000030376 | JASPAR |
| Stat3 | 0.000000023903 | JASPAR |
| SPI1 | 0.0000024536 | JASPAR |
| ELF5 | 0.0000033762 | JASPAR |
| SPIB | 0.0000050337 | JASPAR |
BED file downloads
Top 10 Example Regions
| Location | Gene Link | Dist. |
|---|---|---|
| chr3: 156966480-156966630 | VEPH1 | 45.31 |
| chr5: 131833480-131833630 | RAD50 | 48.51 |
| chr17: 17804080-17804230 | LRRC48 | 52.75 |
| chr17: 17804080-17804230 | TOM1L2 | 52.75 |
| chr17: 17804080-17804230 | AC087163.3 | 52.75 |
| chr10: 121013140-121013290 | SFXN4 | 53.22 |
| chr9: 134278240-134278390 | POMT1 | 54.05 |
| chr9: 134278240-134278390 | PPAPDC3 | 54.05 |
| chr7: 151157080-151157230 | ETF1P2 | 58.9 |
| chr2: 96917500-96917650 | TMEM127 | 60 |