SOM cluster: 494
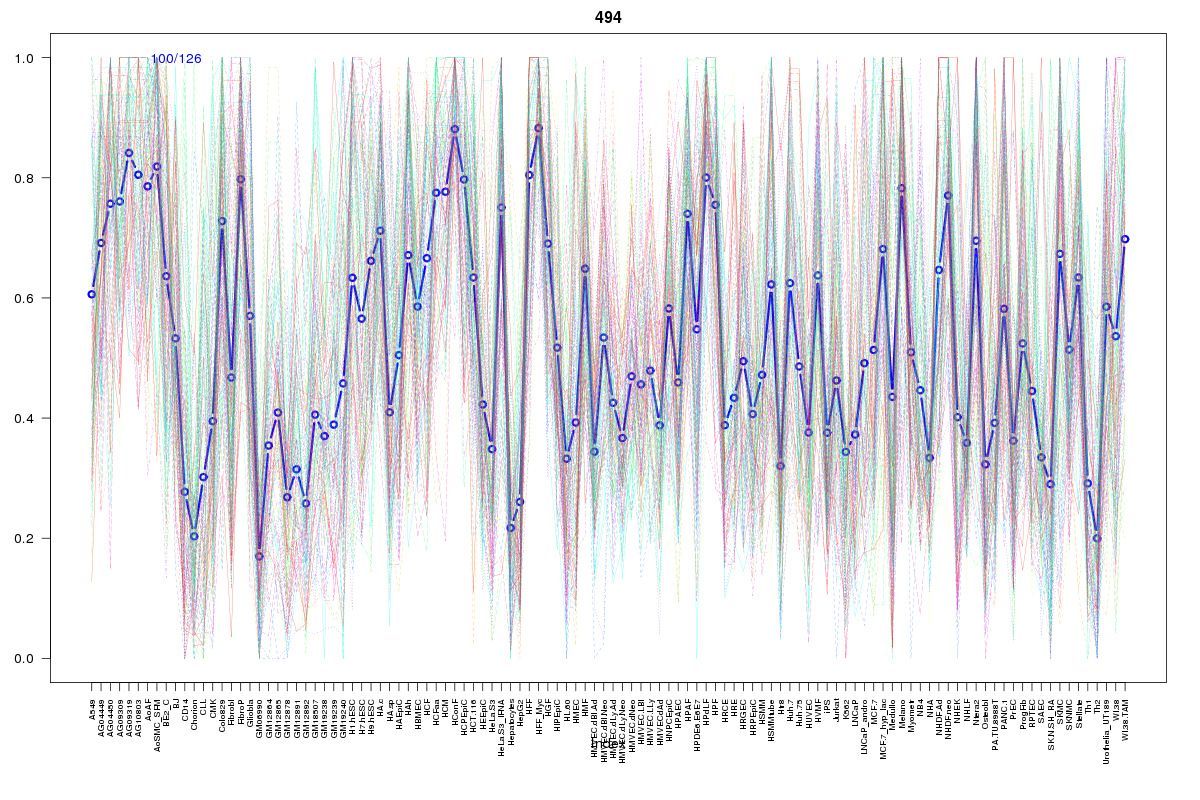
Cluster Hypersensitivity Profile

Genomic Location Trend
These plots show the distribution of the DHS sites surrounding the Transcript Start Site of the nearest gene.
Stats
Number of sites: 126Promoter: 9%
CpG-Island: 1%
Conserved: 73%
Enriched Motifs & Matches
Match Detail: [Jaspar]
|
| ||
|---|---|---|
| Sites: 68/100 | e-val: 0 | ||
| Factor | e-val(match) | DB |
| CTCF | 0.00000000000065159 | JASPAR |
| INSM1 | 0.000079882 | JASPAR |
| TAL1::TCF3 | 0.016402 | JASPAR |
| Zfp423 | 0.018306 | JASPAR |
| MYC::MAX | 0.037702 | JASPAR |
BED file downloads
Top 10 Example Regions
| Location | Gene Link | Dist. |
|---|---|---|
| chr8: 121820960-121821110 | SNTB1 | 40.74 |
| chr8: 121820960-121821110 | RP11-713M15.1 | 40.74 |
| chr13: 44765700-44765850 | LINC00390 | 43.65 |
| chr13: 44765700-44765850 | SMIM2-AS1 | 43.65 |
| chr8: 121136600-121136750 | COL14A1 | 49.36 |
| chr1: 145014640-145014790 | SEC22B | 51.03 |
| chr1: 145014640-145014790 | PDE4DIP | 51.03 |
| chr3: 13537980-13538130 | FBLN2 | 56.41 |
| chr3: 13537980-13538130 | HDAC11-AS1 | 56.41 |
| chr12: 27856780-27856930 | MANSC4 | 59.36 |