SOM cluster: 477
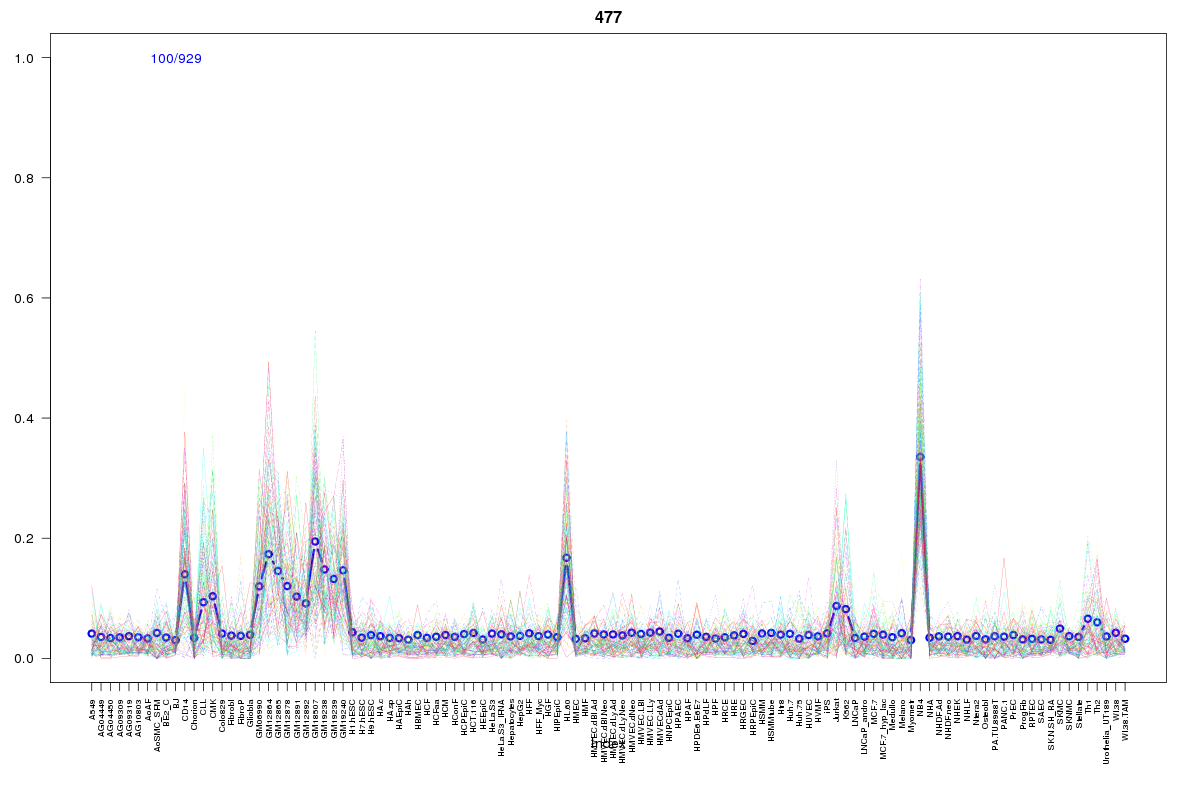
Cluster Hypersensitivity Profile

Genomic Location Trend
These plots show the distribution of the DHS sites surrounding the Transcript Start Site of the nearest gene.
Stats
Number of sites: 929Promoter: 3%
CpG-Island: 0%
Conserved: 21%
Enriched Motifs & Matches
Match Detail: [Jaspar]
|
| ||
|---|---|---|
| Sites: 25/100 | e-val: 8.4e-19 | ||
| Factor | e-val(match) | DB |
| SPI1 | 0.0000000025693 | JASPAR |
| SPIB | 0.00000017002 | JASPAR |
| FEV | 0.0000048127 | JASPAR |
| ELF5 | 0.00002444 | JASPAR |
| ELK4 | 0.00044354 | JASPAR |
BED file downloads
Top 10 Example Regions
| Location | Gene Link | Dist. |
|---|---|---|
| chr12: 111125405-111125555 | HVCN1 | 38.53 |
| chr12: 111125405-111125555 | PPP1CC | 38.53 |
| chr1: 43202765-43202915 | PPIH | 40.82 |
| chr1: 43202765-43202915 | LEPRE1 | 40.82 |
| chr1: 43202765-43202915 | CLDN19 | 40.82 |
| chr22: 39763080-39763230 | RPL3 | 44.18 |
| chr11: 73682340-73682490 | UCP2 | 50.37 |
| chr11: 73682340-73682490 | PAAF1 | 50.37 |
| chr8: 61729620-61729770 | RP11-33I11.2 | 53.31 |
| chr8: 61729620-61729770 | AC022182.1 | 53.31 |