SOM cluster: 466
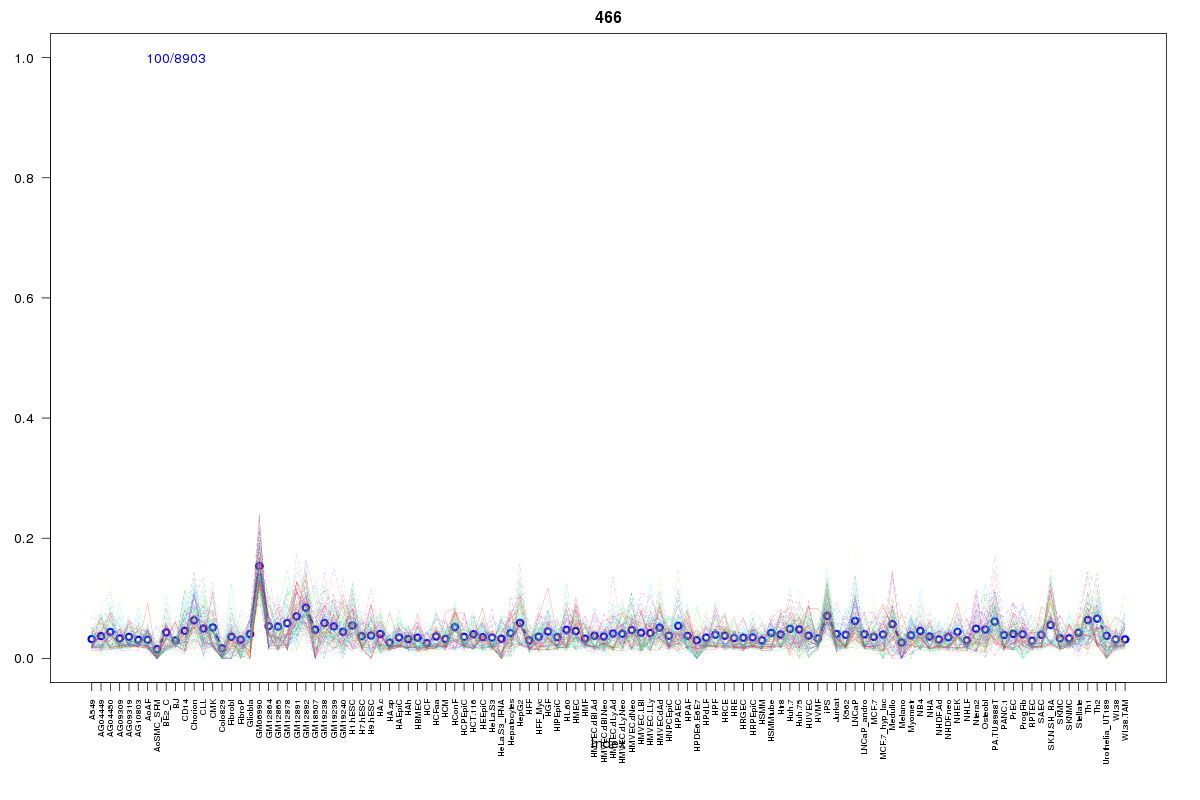
Cluster Hypersensitivity Profile

Genomic Location Trend
These plots show the distribution of the DHS sites surrounding the Transcript Start Site of the nearest gene.
Stats
Number of sites: 8903Promoter: 2%
CpG-Island: 6%
Conserved: 32%
Enriched Motifs & Matches
Match Detail: [Jaspar]
|
| ||
|---|---|---|
| Sites: 81/100 | e-val: 1.80067e-42 | ||
| Factor | e-val(match) | DB |
| PLAG1 | 0.000000001699 | JASPAR |
| SP1 | 0.0000000046459 | JASPAR |
| CTCF | 0.00061571 | JASPAR |
| INSM1 | 0.00066476 | JASPAR |
| TFAP2A | 0.003851 | JASPAR |
|
| ||
| Sites: 37/100 | e-val: 0.000000000042 | ||
| Factor | e-val(match) | DB |
| INSM1 | 0.0000019304 | JASPAR |
| PLAG1 | 0.000088427 | JASPAR |
| Tal1::Gata1 | 0.00025488 | JASPAR |
| TFAP2A | 0.00060006 | JASPAR |
| SP1 | 0.00083504 | JASPAR |
|
| ||
| Sites: 28/100 | e-val: 0.00069 | ||
| Factor | e-val(match) | DB |
| Myf | 0.00000083877 | JASPAR |
| SP1 | 0.0000012804 | JASPAR |
| SPIB | 0.0075566 | JASPAR |
| SPI1 | 0.015692 | JASPAR |
| Tal1::Gata1 | 0.01658 | JASPAR |
|
| ||
| Sites: 28/100 | e-val: 1.2 | ||
| Factor | e-val(match) | DB |
| PLAG1 | 0.000000012112 | JASPAR |
| PPARG::RXRA | 0.002546 | JASPAR |
| Zfx | 0.01382 | JASPAR |
| MZF1_1-4 | 0.017722 | JASPAR |
| Egr1 | 0.019809 | JASPAR |
BED file downloads
Top 10 Example Regions
| Location | Gene Link | Dist. |
|---|---|---|
| chr1: 150235945-150236095 | snoU13 | 16.72 |
| chr1: 179760425-179760575 | IFRG15 | 33.3 |
| chr7: 158822165-158822315 | WDR60 | 37.97 |
| chr9: 138019205-138019355 | RP11-399H11.3 | 41.48 |
| chr3: 195306505-195306655 | AC069513.4 | 41.65 |
| chr3: 138661245-138661395 | MRPS22 | 41.74 |
| chr9: 132643725-132643875 | TOR1B | 41.97 |
| chr9: 132643725-132643875 | TOR1A | 41.97 |
| chr9: 138439145-138439295 | PAEP | 43.83 |
| chr9: 37427865-37428015 | ZBTB5 | 45.24 |