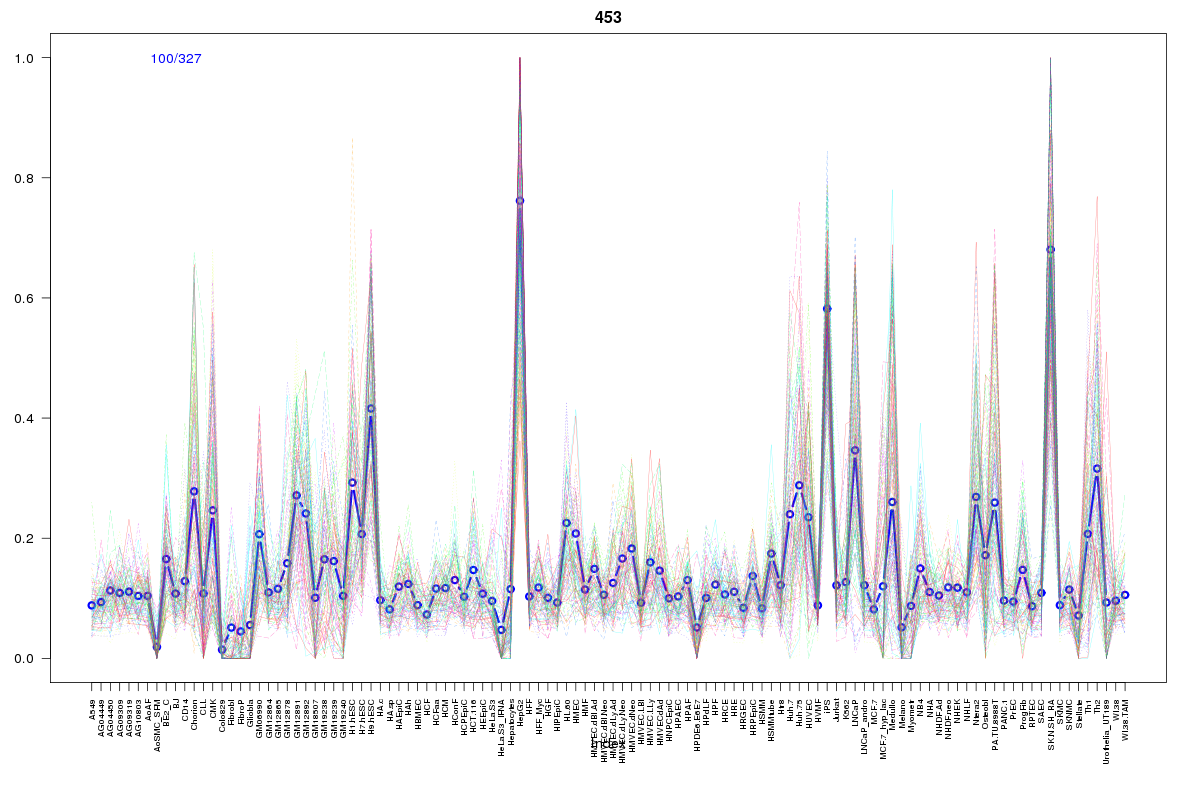
SOM cluster: 453
Cluster Hypersensitivity Profile

Genomic Location Trend
These plots show the distribution of the DHS sites surrounding the Transcript Start Site of the nearest gene.
Stats
Number of sites: 327Promoter: 48%
CpG-Island: 84%
Conserved: 78%
Enriched Motifs & Matches
Match Detail: [Jaspar]
|
| ||
|---|---|---|
| Sites: 90/100 | e-val: 0 | ||
| Factor | e-val(match) | DB |
| SP1 | 0.00000030066 | JASPAR |
| TFAP2A | 0.00041595 | JASPAR |
| PLAG1 | 0.00097554 | JASPAR |
| Egr1 | 0.0034713 | JASPAR |
| Zfx | 0.027159 | JASPAR |
|
| ||
| Sites: 76/100 | e-val: 0 | ||
| Factor | e-val(match) | DB |
| SP1 | 0.000047139 | JASPAR |
| TFAP2A | 0.00032338 | JASPAR |
| PLAG1 | 0.0010573 | JASPAR |
| Klf4 | 0.01177 | JASPAR |
| E2F1 | 0.062809 | JASPAR |
BED file downloads
Top 10 Example Regions
| Location | Gene Link | Dist. |
|---|---|---|
| chrX: 152907845-152907995 | PNCK | 46.19 |
| chrX: 152907845-152907995 | DUSP9 | 46.19 |
| chr19: 11909640-11909790 | ZNF439 | 47.94 |
| chr2: 160143660-160143810 | TANC1 | 49.39 |
| chr2: 160143660-160143810 | WDSUB1 | 49.39 |
| chr9: 127266965-127267115 | NR5A1 | 49.87 |
| chrX: 48693980-48694130 | PCSK1N | 49.93 |
| chrX: 48693980-48694130 | TIMM17B | 49.93 |
| chr19: 33716685-33716835 | SLC7A10 | 51.45 |
| chr18: 55253525-55253675 | ATP8B1 | 54.69 |